
Collin County, Texas, is one of the fast growing suburban counties in Texas and the U.S. Its relatively young population has a high portion of college educated professional men and women, and it has a growing population of Asian-American voters.
Since the 2016 election, the county net voter registration count has increased from 540K to more than 654K, a net registration increase of 114K registrations. The median age of all registered voters is 47 years with slightly more females (321.4K) than males (290.8K) registered to vote.
Of the nearly 654K currently registered voters, 234.9K have a registration date after the registration cutoff date for the 2016 presidential election. The median age for these new voters is 36 years. For the 2020 election 171.5K (73%) of these 234.9K new voters cast a ballot, accounting for one-third (34.7%) of the 494.3K total early ballots cast in the county.
Collin County, Texas, has been one of the state’s suburban Republican stronghold counties that has been increasingly trending more left-leaning over the last few elections. The chart below shows the margin between Democratic and Republican presidential candidates has steadily narrowed over the last three election cycles.
Democrats forced Republicans to make substantial campaign investments in Texas, including Collin Co., this cycle to just hold even in Texas. In several counties, like Collin Co., the Republican presidential candidate continue a slow slide down toward the 50 percent mark. Meanwhile Democrats continued their steady progress toward the 50 plus 0.1 percent finish line.
|
Collin CO |
2012 |
2016 |
2020 |
|||
|
Rep |
196.9K |
65.0% |
201.0K |
55.6% |
250.2K |
51.6% |
|
Dem |
101.4K |
33.5% |
140.6K |
38.9% |
227.9K |
47.0% |
|
Other |
4.5K |
1.5% |
19.8K |
5.5% |
7.3K |
1.5% |
|
Total |
302.8K |
66.0% |
361.4K |
66.9% |
485.3K |
74.8% |
|
Reg Voters |
458.9K |
100% |
540.1K |
100% |
648.7K |
100% |
|
Texas Election Results for President |
||||||
|
254 COs |
2012 |
2016 |
2020 |
|||
|
Rep |
4.57M |
57.2% |
4.69M |
52.2% |
5.86M |
52.2% |
|
Dem |
3.31M |
41.4% |
3.88M |
43.2% |
5.21M |
46.4% |
|
Other |
115.9K |
1.4% |
406.3K |
4.5% |
160.3K |
1.4% |
|
Vote TL |
7.99M |
58.6% |
8.97M |
59.4% |
11.23M |
66.2% |
|
Reg Voters |
13.65M |
100% |
15.10M |
100% |
16.96M |
100% |
Congressional and State House Districts
In 2018 Democrats flipped two long held Texas congressional districts. Texas Democrat Colin Allred, a former NFL player making his first run for elected office, stunned incumbent Republican Pete Sessions to win his long held 32nd Congressional District, which is split between Dallas and Collin counties. Also in 2018, Lizzie Pannill Fletcher unseated 18-year-incumbent Republican Rep. John
Culberson in the Houston-area race for Texas Congressional District 7, a
district held by Republicans since George H. W. Bush took over the
district in the November 1966 election. Both Allred and Fletcher won re-election in 2020.
Collin County’s own Texas’ 3rd Congressional District includes about four-fifths of the county’s registered voters and occupies the same territory as state house districts 66 and 67 in the southwestern quadrant of the county. In the exceptionally high turnout 2018 midterm election Beto O’Rourke, the Democratic challenger to the state’s incumbent Republican U.S. Senator Ted Cruz, earned 47.9 percent of the vote across the entire 3rd Congressional District and won the vote in state House Districts 66 and 67 by 5.7 points and 5.5 points respectively.
- Polling has found the political terrain in CD3 has become much more favorable for Democrats in 2020.
The 2018 Democratic candidate for HD66, Sharon Hirsch, who is the Democratic candidate again in 2020, lost to the incumbent Republican by just 391 votes. The 2018 Democratic candidate for HD67 lost to the incumbent Republican by just 2.2 points.
This year, Democrats have focused national attention and money on the 3rd and 32nd Congressional Districts and state House Districts 66 and 67, to hold the 32nd, and to flip CD3 and HD’s 66 and 67. More people cast an early ballot across all those districts than voted in the entire 2016 election. In 2020, Republicans narrowly won HD’s 66 and 67, and won CD3 by margins similar to the party's 2018 wins. But those Republican candidates were forced to campaign hard, and spend campaign money for the first time in many election cycles to remain even with 2018.
|
District |
Total Ballot Cast 2016 |
2020 Reg Voters |
2020 Ballot Cast |
% 2020 Voter |
2020 Rep Votes |
2020 Rep % |
2020 Dem Votes |
2020 Dem % |
|
Pres |
369,895 |
653,946 |
494,393 |
75.6% |
252,318 |
51.3% |
230,945 |
46.9% |
|
Senate |
|
653,946 |
494,393 |
75.6% |
263,074 |
54.6% |
207,005 |
43.0% |
|
HD 33+ |
48,201 |
92,712 |
70,146 |
75.7% |
39,161 |
59.0% |
27,181 |
41.0% |
|
HD 66 |
73,921 |
118,983 |
89,817 |
75.5% |
42,728 |
49.6% |
41,879 |
48.6% |
|
HD 67 |
76,648 |
131,215 |
99,588 |
75.9% |
49,113 |
51.7% |
45,867 |
48.3% |
|
HD 70 |
87,991 |
173,428 |
130,660 |
75.3% |
76,754 |
61.9% |
47,343 |
38.2% |
|
HD 89 |
79,722 |
137,608 |
104,182 |
75.7% |
58,102 |
59.0% |
37,837 |
38.5% |
|
Total |
366,483 |
653,946 |
494,393 |
75.6% |
265,858 |
56.6% |
200,107 |
42.6% |
|
TX-03 |
326171 |
575,784 |
435,478 |
75.6% |
230,512 |
55.1% |
179,458 |
42.9% |
|
TX-04+ |
19,793 |
39,812 |
30,340 |
76.2% |
21,582 |
74.2% |
6,808 |
23.4% |
|
TX-32+ |
20,532 |
38,350 |
28,575 |
74.5% |
15,438 |
56.1% |
11,499 |
41.8% |
|
Total |
366,496 |
653,946 |
494,393 |
75.6% |
267,532 |
56.3% |
197,765 |
41.6% |
|
+ For the Collin Co. territory only |
||||||||
2020 Election Results for Collin Co. Districts
District Appellate Courts
The justice system of Texas handles critical cases, with outcomes that directly affect the economy, our community, and ultimately our own lives. When family, criminal or civil case decisions made by lower courts seem unfair to one party or the other, the Court of Appeals is the first recourse. The Texas Courts of Appeal are distributed in fourteen districts around the state of Texas, with the 5th District Court of Appeals covering by far the largest number of Texans.
The Court of Appeals, Fifth District, consists of a Chief Justice and 12 associate justices. This appellate court is one of Texas' most important courts with jurisdiction over criminal, family and civil appeals cases for Dallas, Collin, Rockwall, Kaufman, Grayson and Hunt counties. Like the Texas Supreme Court and Court of Criminal Appeals, Justices of the Texas Courts of Appeals are elected to six-year terms by general election.
Collin County Democrats’ biggest win in the 2018 election was the part they played in flipping Texas' 5th Court of Appeals. For 19 uninterrupted years, all 13 elected judges on Texas' 5th District Court of Appeals were Republicans, earning a reputation for being one of the most conservative courts in the state.
Even though Dallas County voters have given Democrats running for this appellate court big vote margin wins for past elections, the margin was never enough to counter balance their vote losses in the five conservative-leaning counties of the district, in particular Collin County, the largest by far of the district’s conservative counties. Democrats routinely lost Collin Co. to Republicans 30 to 70 percent.
But that changed dramatically in 2018, when all eight Democrats on the ballot earned 42% to 43% percent of the vote in Collin County. That 10-13 point better showing, combined with their large win margins in Dallas County gave the new Democratic Justices the edge they needed to prevail in the six county district.
Three more Republican incumbent justices were up for re-election in 2020, and three Democrats filed to replace them:
- District Judge Bonnie Lee Goldstein, who currently sits on Texas’ 44th District Court, won the district race for Place 3 on the bench 52.3 percent to 47.7 percent by losing Collin Co. by only 43.4 percent to 56.6 percent;
- District Judge Craig Smith, who currently sits on Texas’ 192nd District Court, won the district race for Place 6 on the bench 52.6 percent to 47.4 percent by losing Collin Co. by only 43.5 percent to 56.5 percent;
- District Judge Dennise Garcia, who currently sits on Texas’ 303rd District Court, won the district race for Place 8 on the bench 52.9 percent to 47.1 percent by losing Collin Co. by only 43.7 percent to 56.3 percent.
Over just two election cycles Democrats flipped an all Republican appellate court to a court dominated by Democrats.
18 to 29 Year Old Voters Boosted Overall 2020 Turnout
The residents of Collin County, especially those who reside in the four key battleground districts, had strong interest in the 2020 election. Across Collin County almost 70 percent of the registered voters cast an early in-person or mail ballot. In Election Day voting an additional 6 percent of the county’s registered voters cast ballots. President elect Joe Biden won just over 30K more votes than the 5 Democratic state house district candidates running in Collin County. President Trump under performed incumbent U.S. Senator John Cornyn and the 5 Republican state house district candidates running in Collin County.
A larger percentage of youngest group of voters, the 18-29 year olds, voted this year as compared to 18-29 year olds in 2016 for the entire election. A record 61 percent of this youngest group of voters cast a ballot compared with 42 percent for the entire 2016 election. All the other age groups also increased their turnout levels compared with their 2016 full election turnout proportions.
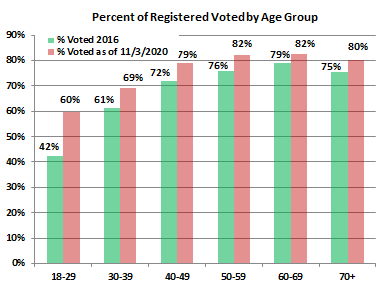
The youngest most left-leaning age group, the 18 to 29 year olds, had a record turnout of 60% of that registered group of voters. Those youngest voters helped to narrow the margin of Trump’s win in the county to just 4.3 percentage points — 51.3 percent to 46.9 percent. In 2016, Trump won the county 55.6 percent to 39 percent. However the oldest most right-leaning voters also slightly increased their turnout levels, which by the numbers appears to have given Trump the edge he needed to reach his relatively narrow win. Unfortunately for down ballot Democrats, younger voters apparently weren’t as diligent as older voters about marking their ballots for the lesser known down ballot Democratic candidates. Those younger voters might have helped the Democrats running for state house districts 66 and 67 overcome their Republican opponents had they completed their ballots.
Keep in mind, the 2020 performance percentages are on a significantly higher base of registered voters than were registered for the 2016 election. And, those who were age 25-29 four years ago are in the age 30-39 age group this year, and those who were ages 14-17 four years ago are now registered to vote. The chart below shows the turnout of registered voters for each age group, as well as those voting for the first time in any election.

Below is a table of turnout history for Collin County
|
Date |
Total Reg Voters |
Delta |
Total Votes Cast |
% Reg Voters |
ED Ballots Cast |
% ED Ballots Cast |
Total Mail Ballots Cast |
% Total Mail Ballots Cast |
EV Ballots Cast |
% EV Cast |
|
Nov-88 |
122.7K |
|
91.2K |
74.3% |
71.0K |
77.8% |
1.8K |
0.0% |
18.4K |
20.2% |
|
Nov-90 |
122.1K |
|
71.6K |
58.6% |
58.3K |
81.5% |
1.4K |
0.0% |
11.9K |
16.6% |
|
Nov-92 |
153.7K |
31.0K |
128.8K |
83.8% |
83.2K |
64.6% |
2.5K |
0.0% |
43.1K |
33.4% |
|
Nov-94 |
175.9K |
|
98.5K |
56.0% |
64.9K |
65.9% |
1.9K |
0.0% |
31.7K |
32.2% |
|
Nov-96 |
231.2K |
77.4K |
132.9K |
57.5% |
80.0K |
60.2% |
2.6K |
0.0% |
50.4K |
37.9% |
|
Nov-98 |
263.6K |
|
84.1K |
31.9% |
58.0K |
69.0% |
1.6K |
0.0% |
24.4K |
29.0% |
|
Nov-00 |
300.4K |
69.3K |
177.7K |
59.1% |
100.4K |
56.5% |
2.0K |
1.1% |
75.2K |
42.3% |
|
Nov-02 |
319.2K |
|
129.8K |
40.7% |
78.8K |
60.7% |
3.5K |
2.7% |
47.5K |
36.6% |
|
Nov-04 |
369.4K |
69.0K |
246.6K |
66.8% |
92.6K |
37.6% |
4.0K |
1.6% |
150.0K |
60.8% |
|
Nov-06 |
381.8K |
|
138.7K |
36.3% |
75.6K |
54.5% |
1.5K |
1.1% |
61.6K |
44.4% |
|
Nov-08 |
426.0K |
56.6K |
298.6K |
70.1% |
78.0K |
26.1% |
9.0K |
3.0% |
211.6K |
70.9% |
|
Nov-10 |
424.7K |
|
157.1K |
37.0% |
66.0K |
42.0% |
3.3K |
2.1% |
87.8K |
55.9% |
|
Nov-12 |
462.1K |
36.1K |
302.8K |
65.5% |
79.4K |
26.2% |
10.9K |
3.6% |
212.5K |
70.2% |
|
Nov-14 |
489.0K |
|
177.8K |
36.4% |
71.6K |
40.3% |
8.6K |
4.9% |
97.8K |
55.0% |
|
Nov-16 |
540.1K |
78.0K |
366.5K |
67.9% |
60.9K |
16.6% |
15.6K |
4.3% |
290.0K |
79.1% |
|
Nov-18 |
581.7K |
|
357.0K |
61.4% |
67.0K |
18.8% |
18.3K |
5.1% |
271.9K |
76.1% |
|
Nov-20 |
650.1K |
110.1K |
494.3K |
76.0% |
36.7K |
7.4% |
35.7K |
7.2% |
421.9K |
85.4% |
No comments:
Post a Comment