
Congratulations Democrats and Progressives — You Won. Do not accept any narrative other than one of a big win from hard-fought campaigns.
Democrats elected an unprecedented number of women, including two Muslim women, turned at least 6 state legislatures blue, demanded the Medicaid Expansion to Obamacare in three red states, and passed referendums in favor of recreational and medical marijuana and an increased minimum wage in several states.
More than half of eligible voters in the U.S. turned out to cast a ballot in the 2018 midterm elections, a record-high in modern history. Michael McDonald, an associate professor of political science at the University of Florida, estimates that 118 million people voted in the midterms, about 50.1 percent of eligible voters. That turnout is about 11 points higher than the average for midterm turnout of 39.4 percent in at least the past three decades, since 18- to 20-year-olds became eligible to vote. In 2014, 83 million people turned out to vote. That’s the highest recorded rate for the midterms since 1914 when turnout was 50.4% and women didn’t have the vote.
Update: As of Friday, December 7, 2018, with only one House race not yet called — North Carolina's 9th Congressional District where the state elections board has been been investigating allegations of election fraud over mail-in absentee ballots in the November general election — Democratic candidates earned 60,721,208 votes in House seats across the country in the 2018 midterms, compared to Republicans’ 50,987,044, according to raw data compiled by the Cook Political Report, an independent, non-partisan political analysis website.In 2018, Democrats earned a new record turnout victory in a midterm House election, surpassing the Democratic Party’s win over Republicans by more than 8.7 million votes in 1974, just months after President Richard Nixon resigned from office in disgrace. The national House vote margins in the midterm wave years of 1994, 2006 and 2010 were R+7 points, D+6.4 points and R+6.6 points, respectively. Democrats also rolled up nearly 16 million more votes in U.S. Senate races nationwide.
Republicans lost a net of 40 House seats, losing control of that chamber of Congress by nearly 9 percentage points in popular vote, 53.4 percent to 44.9 percent; and while they gained Senate seats, Republicans go from the 52-48 majority they enjoyed at the beginning of the 2017-2018 cycle to 53-47 next year — despite one of the most favorable Senate maps in a generation.
Republicans received the same kind of “thumping”they got back in 2006, and similar to the “shellacking” Republicans gave Democrats in 2010. They midterms delivered a divided government for the 2019-2020 term.
And that divided government takes away leverage Pres. Trump and Republicans might have in any budget shutdown fight. If there’s a shutdown, House Democrats under Speaker Pelosi’s leadership can pass a clean continuing resolution to fund the government — and dare Senate Majority Leader Mitch McConnell to oppose it.
Elections, after all, do have consequences.
25 states recorded 50% turnout or higher with Colorado (62.2%), Minnesota (64.3%), Montana (62.1%), Oregon (61.3%) and Wisconsin (61.2%) exceeding 60%. Historically, the midterms have always had a weaker turnout than presidential elections — but not so much this year.
- Nate Silver says media missed massive ‘blue wave’ while covering ‘stories about Trump voters in truck stops’.
- It Was A Big, Blue Wave: Democrats Pick Up Most House Seats In A Generation.
- Young voters (18-29) supported Democrats by 44 points in 2018, up 18 points from 2016. Moreover, white young voters gave Democrats an impressive 26 point margin in 2018. For that matter, Democrats were also +9 on white voters 30-44. That means Democrats carried all white voters under 45 in 2018 and quite easily at that!
- As polling sources suggest, Democrats carried white college voters in 2018 (+5) with a solid shift relative to 2016. Both white college women and men contributed to this shift but the largest contribution was by white college women. White noncollege voters, on the other hand, continued to be a problem at -26, only a slight improvement over the previous election.
- Among nonwhite groups, Asians showed the largest support gains for the Democrats. But, contrary to the exit polls, Hispanics showed a slight slippage in support.
- Democrats carried suburban white college voters by 7 points, representing a strong 12 point shift over 2016 in the Democrats’ favor. This is more less as expected.
- But by and large, the strongest shifts in the Democrats’ direction were within rural areas! Comparing overall urban vs. suburban vs. rural areas, the respective pro-Democratic shifts were 1, 5 and 7 points. You see roughly the same pattern when comparing urban whites vs. suburban whites vs. rural whites. You even see a 7 point shift toward the Democrats among white noncollege rural voters!
- Even more amazing, the Catalist data show a 25 point shift toward the Democrats among rural 18-29 year olds and a 17 point shift among 30-44 year olds. Most mind-blowing of all, Democrats actually carried rural 18-29 year olds in 2018 by 8 points.
- A vast majority of counties showed increased Democratic support in 2018 House election
- WaPo: Analysis of Texas Election Results
While final results from across the nation have been slow to finalize, they show that Democrats had perhaps less of a blue tsunami wave election and more of a rising blue tide that will continue to rise through the 2020 election and beyond.
It was clear on Election Night Democrats would win control of the U.S. House, but the scale of the victory was initially under reported by the mainstream media. Why did the media initially report Democratic wins were underwhelming? Mainly, several marquee Democratic candidates the media had built up in the final weeks leading to election day did not score election night victories.
Beto O’Rourke, the most hyped Democratic candidate of the cycle, lost his U.S. Senate race against the incumbent Sen. Ted Cruz. O’Rourke's loss wasn’t unexpected — an O’Rourke win would have been an epochal surprise — but that loss in particular took some wind out of hopeful Democrats' sails. In Florida, polling showed the gubernatorial candidate Andrew Gillum and Senator Bill Nelson both with an edge, but when election night results came in, they were down. Neither race is officially called yet, and the Senate contest is headed to a hand recount, but Republicans Ron DeSantis and Rick Scott lead in those two races, for governor and Senate, respectively. In Georgia, Democrat Stacey Abrams also trailed Republican Brian Kemp in a close, and closely watched, race.
Even so, the blue tide of Democratic midterm wins keeps rising.
Democrats have gaining at least 37 U.S. House seats as of this writing, for a total of 232 seats — 14 more than is needed for a majority — with three competitive races; where Democrats lead in the ballot counts not yet called. Heading into the November 6, 2018, midterm election, Republicans held a 235-193 advantage over Democrats in the 435-member U.S. House. All 435 seats — including seven vacancies — were up for election, with Democrats needing to add 23 seats to win majority control of the chamber.
In winning control of the U.S. House, Democrats flipped congressional districts long-held by Republicans. Lucy McBath turned in a win over Republican Karen Handel — who had beaten Jon Ossoff in the heavily covered 2017 special election in Georgia’s Sixth, a long held Republican district.
Texas Democrat Colin Allred, a former NFL player making his first run for elected office, stunned incumbent Republican Pete Sessions to win his long held 32nd Congressional District in Texas. In another Texas-sized flip, Texas Democrat Lizzie Pannill Fletcher unseated 18-year-incumbent Republican Rep. John Culberson in the Houston-area race for Texas Congressional District 7, a district held by Republicans since George H. W. Bush took over the district in the November 1966 election.
The very cradle of Reagan Republican conservationism and the birthplace of Richard Nixon, California’s Orange County, turned blue with Democrats wining all seven congressional districts within or that overlap into that densely populated county, including stalwart Republican Rep. Dana Rohrabacher's 48th District.
Republicans no longer hold any House seats in New England, Axios reports, indicating that the party’s shift to the right since President Donald Trump’s election has pushed out more moderate conservatives. The final GOP representative was unseated by Democrat Jared Golden in Maine’s 2nd Congressional District Thursday. Golden was declared the winner by about 3,000 votes, NPR said, after taking into account Maine’s new ranked-choice voting system.
Of all New England’s U.S. Senate seats, Republicans hold just one: Susan Collins of Maine, who faces a reelection in 2020. Some Democrats, including Obama’s former National Security Adviser Susan Rice, are already considering a run against Collins. Last month, the senator disillusioned many of her more liberal constituents when she cast a vote vital to putting conservative Supreme Court Justice Brett Kavanaugh on the bench.
Arguably the biggest win for Democrats since Donald Trump was elected is Democrat Kyrsten Sinema’s come-from-behind win in the Arizona race for the U.S. Senate seat being vacated by the Republican Jeff Flake. For the past fifty years, Arizona has been the anchor of the Sun Belt pro-business, anti-tax libertarian conservatism that Barry Goldwater pioneered. Sinema is the first Democrat to be elected to the Senate from Arizona since 1988, and the first Democrat to win an open Senate seat in the state since Dennis DeConcini was elected, in 1976. The firsts don’t stop there. Sinema, a forty-two-year-old congresswoman for Arizona’s Ninth District, will also be the first female senator from Arizona, and the first openly bisexual senator from anywhere.
Last week, in a multi-candidate field, incumbent Republican U.S. Senator Cindy Hyde-Smith for Mississippi finished with 41.5% of the vote, to Democrat Mike Espy’s 40.6 percent. Espy is an African American former congressman who just might take that Senate seat from the Republican. Because neither candidate reached the 50% threshold in the November 6th election, there will be a special election on Nov. 27, which is just a few days away. Hyde-Smith is noted for making a statement on the campaign trail that it might be a “great idea” to make it harder for some people to vote, and, in an implied reference to her African-American opponent, said, “If he [referring to a local white rancher] invited me to a public hanging, I’d be on the front row.” Mike Espy taking this Senate seat would overshadow Sinema’s Arizona Senate seat win.
 |
| Democratic Party Decline 2009—2018 |
 |
| States With Unified Party Control 2017-2018 |
After the 2016 election, Republicans controlled a record 67 (68%) of the 98 partisan state legislative chambers in the nation — 36 senate chambers and 31 house chambers — more than twice the number (31) in which Democrats had majority control, according to the bipartisan National Conference of State Legislatures (NCSL).
During 2017 and 2018, Republicans held more total state legislative seats in the nation, well over 4,100 of the 7,383, than they have since 1920. Democrats held total control of just 13 state legislatures. Republicans held state government trifectas — where one political party holds the governorship, a majority in the state senate, and a majority in the state house — in 26 states, and Democrats held trifectas in only 8 states, with divided partisan control in the remaining 16 states.
From 2009 through the 2016 election, Republicans had gained control of the gubernatorial office in 33 states, a record high last seen in 1922, and flipped 69 Democratic seats in the U.S. House seats to Republican control, and flipped 13 Democratic seats in the U.S. Senate to Republican control.
In the 2018 midterms, Democrats started to get some of it back — but the party still has a lot catching up to do in 2020.
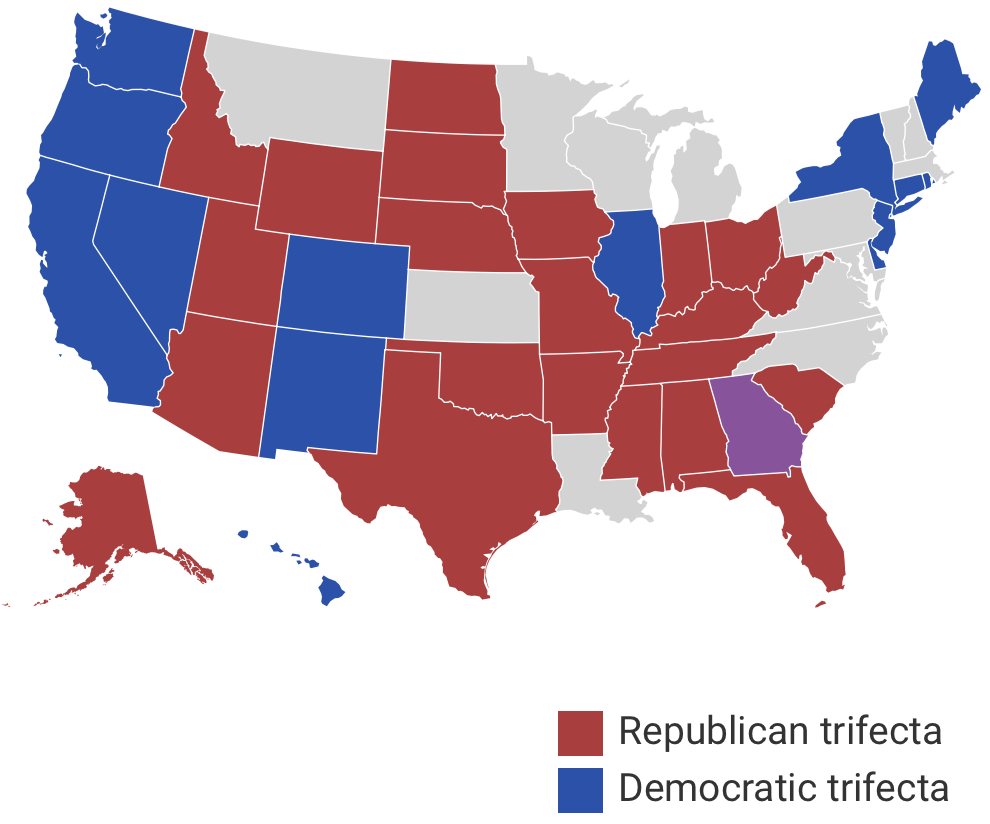 |
| States With Unified Party Control After 2018 Election |
Democrats emerged from the 2018 midterm election with a net gain in state government trifectas, but Republicans still retain a net advantage of at least eight trifectas over Democrats. With the Georgia gubernatorial race called for the Republican Candidate, the new trifecta count stands at 14 Democratic, 23 Republican, 13 divided. The 37 total trifectas ties with 2013 and 2014 as being the most trifectas in recent history.
In addition, Democrats gained enough seats to deprive Republicans of supermajorities in Michigan, North Carolina and Pennsylvania. This will keep Republicans from having enough votes to override the vetoes of Democratic governors of those states. Democrats achieved supermajorities for themselves in seven chambers.
The 2018 midterm election set a record for the number of single-party-controlled legislatures. When the new legislators take their seats in 2019, Minnesota is the only state in the nation where the legislature is divided — the Senate remains in Republican control, and the House flipped to Democratic control. Minnesota Democrats fell one seat short of flipping the state senate. Last time there was only one divided state legislature was over 100 years ago in 1914.
A majority of the governors holding veto power over redistricting in 2021 are now Democrats. Moreover, in most states where Democrats won control of a legislative chamber on Tuesday, the legislature has a role in the congressional redistricting process — although Colorado voters took this power away from the legislature via the initiative process.
In short, Republican losses in state legislatures were typical for a midterm election, but these losses could translate into larger losses for the party in the future.
The state legislative pickups include:
- In New Hampshire, both the House and Senate flipped from Republican to Democratic control. This ended the Republican state government trifecta (where one party controls both chambers of the legislature and the governor’s office). Incumbent GOP. Gov. Chris Sununu (R) was re-elected.
- In New York, the Senate flipped from Republican to Democratic control. This gave Democrats a trifecta, as they retained control of the House and the Democratic governor, Andrew Cuomo, won reelection. This is one of five trifectas Democrats won in 2018.
- Colorado Democrats took control of the Senate, flipping the state from divided power to trifecta control for Democrats.
- Maine Democrats won control of the Senate and the governor’s office, assuming trifecta control. Democrats retained control of the state House.
- Republicans took control of the Alaska House, retained control of the state Senate, and won the governor’s office that is currently held by an independent. This gives the Alaska GOP trifecta control.[1]
- Minnesota replaced one Democratic governor with another, and the House changed from Republican to Democratic control. But the Senate remained in GOP hands.
- Arizona: Democrats are two seats away from taking a majority in the state House and three seats away from a majority in the Senate.
- Florida: Democrats are 14 seats away from a majority in the state House.
- Georgia: Democrats are 28 seats away from taking a majority in the state House, but they’re hoping to gain seats in 2020.
- Iowa: Democrats are four seats away from a majority in the Iowa state House.
- Kansas: Democrats are trying to break Republican supermajorities in both chambers; Democrat Laura Kelly won the governor’s seat in 2018.
- Michigan: Democrats broke a Republican supermajority in the state Senate in 2018 and are four seats away from flipping the chamber.
- Minnesota: Democrats are two seats away from a majority in the state Senate. They won control of the state House in 2018.
- North Carolina: Democrats are six seats away from taking control of the state House.
- Pennsylvania: Democrats broke a Republican supermajority in the state Senate in 2018. They are 9 seats away from a majority in the state House, and four seats away from a majority in the state Senate.
- Texas: Democrats are nine seats away from a majority in the Texas state House.
- Virginia: Democrats are two seats away from a majority in the state House of Delegates, and two seats away from a majority in the state Senate as well. Elections are coming up in 2019.
- Wisconsin: Democrats are three seats away from a majority in the Wisconsin state Senate.


 Over 8.3 million Texans turned out to cast ballots in the 2018 midterm election, yielding a turnout rate rivaling presidential election turnout rates. It’s an astonishing turnout figure considering only about 4.6 million Texans cast ballots in the 2014 midterm election — a difference of almost 3.7 million.
Republican Sen. Ted Cruz finished with 50.9 percent of the vote, Rep. Beto O’Rourke earned 48.3 percent of the vote, and the rest went to Neal Dikeman, a Libertarian. O’Rourke, came within 3 percentage points of defeating Sen. Ted Cruz, which is close enough to put Texas at the center of two of the big post-election questions: Is Texas a 2020 swing state? And; Will O’Rourke run for president in 2020, or challenge Sen. John Cornyn for his Senate seat in 2020?
While Beto O’Rourke lost his bid to unseat Sen. Ted Cruz, by three percentage points, his campaign energy activated voters who were either apathetic, or thought they did not make a difference, or thought no one cared about them — the state’s Latinos, Millennials, GenZs, and other typical non-voters. O’Rourke won the female vote and voters age 44 and under. O’Rourke was also more popular with women age 45 and older than with men in the same age cohort. O’Rourke was not popular with Anglo voters, but non-Ango voters were a substantial part of his voter base.
By earning 48.3 percent of the vote, O’Rourke performed better than any Democrat had in a statewide race in Texas in a long time. Even as O’Rourke fell short overall, according to the CNN exit poll, he won 58 percent of voters under 45, and 71 percent of voters under 30. Cruz won 58 percent of the votes of those 45 and older. O’Rourke, according to the exit poll, won 34 percent of white voters. Four years ago, Wendy Davis captured only a quarter of the white vote.
Even though he won just 32 of the state’s 254 counties, O’Rourke’s margins within the state’s booming metro areas is evidence those parts of the state are trending more Democratic. O’Rourke’s county wins includes six counties Hillary Clinton lost in 2016, among them Williamson and Hays counties in Central Texas and Tarrant County, known as the most reliably conservative large urban county in America. Perhaps, no longer.
O’Rourke did not activate left-leaning Texas voters single handed, says Josh Blank, manager of polling and research for the Texas Politics Project at the University of Texas.
“There’s no doubt that Beto O’Rourke had coattails, but it is also the case that Beto benefited from strong, well-funded congressional races in and around the urban areas that he needed to turn out for him,” says Blank. “This is what happens when a party actually organizes and recruits good candidates and runs good campaigns because the fact is that Beto O’Rourke couldn’t be in Houston, Dallas, San Antonio and Austin at the same time.”There is no doubt O’Rourke was fundamentally buoyed by a "critical mass" of local campaign activity across Texas, like Beverly Powell’s campaign success in Tarrant County in reclaiming Wendy Davis’ former state Senate seat from the incumbent Republican, Konni Burton. O’Rourke won Tarrant County by about 4,000 votes. Other notable Democratic wins include:
- Texas Democrats flipped 2 U.S. House Districts with the election of Lizzie Fletcher and Colin Allred.
- Texas Democrats made history by sending the first two Latinas to Congress with the election of Sylvia Garcia and Veronica Escobar.
- Texas Democrats flipped two seats in the Texas State Senate.
- Texas Democrats, led by a slate of female candidates, flipped 12 seats in the Texas State House of Representatives marking the biggest shift in the lower chamber since the 2010 midterm elections.
- Texas Democrats swept Bexar, Fort Bend, and Harris while holding Democratic strongholds along the Rio Grande Valley, and in El Paso, Dallas, and Travis counties.
- Texas Democrats made huge gains in suburban Tarrant, Hays, and Williamson Counties.
- Texas Democrats flipped the DA races in Fort Bend, Bexar, and Dallas Counties.
- Texas Democrats swept the 1st, 3rd, 4th, 5th, 13th, and 14th Court of Appeals, ushering a new era of fairness and justice in Texas.
O’Rourke won 32 of the state’s 254 counties, including the state’s large urban areas. Texas’ urban areas account for about 45 percent of the state’s vote. O’Rourke beat Cruz by nearly 900,000 votes in the state’s urban areas, with 61.8 percent of the vote to Cruz’s 38 percent. Not only did O’Rourke dominate Cruz in and around the state’s five largest urban areas of Houston, Dallas, Fort Worth, Austin and San Antonio, he also won a higher percentage of the vote than Hillary Clinton in the 2016 election.
O'Rourke revealed untapped opportunities for Democrats. Four years ago, U.S. Sen. John Cornyn won the I-35 corridor by nearly 350,000 votes over his Democratic opponent, David Alameel. But O'Rourke carried those same counties by more than 440,000 votes. That is a nearly 800,000-vote swing in just four years.
O’Rourke exposed a blue spine up the middle of Texas along the I-35 corridor from Laredo to the Oklahoma border. O'Rourke flipped counties along the corridor that had not voted for a Democrat for statewide office since Ann Richards first ran for governor in 1990. Even in the counties O'Rourke lost, his defeats were often much narrower than those of past Democratic candidates.
O'Rourke’s performance along the I-35 corridor was supported by a critical mass of other Democrats running their own strong campaigns for congress and the state legislature:
- Five Republican candidates for Congress in Texas, almost all of them big favorites, won with less than 51 percent of the vote. All five of their districts are along the I-35 corridor, making them all but certain to be targeted by Democrats in 2020.
- In the Texas House, Democrats flipped 12 seats previously held by Republicans. Ten of those districts are along I-35.
- In the Texas Senate, Democrats flipped two seats, both along I-35. And they nearly took a third seat north of Dallas, where Republican Angela Paxton won just 51 percent of the vote.
- Analysis: Republicans who barely won in 2018 will be top targets in 2020
- How Democrats Won In Trump Country
Cruz got back more than half of his core urban county losses from metro area suburb counties, like Collin and Denton counties, with Cruz getting 59 percent of the vote on average to O’Rourke’s 41 percent in metro suburban counties. But O’Rourke capped Cruz’s wins in most of metro suburban counties. For example, O'Rourke lost Collin and Denton counties, but by dramatically smaller margins than past statewide Democratic candidates. In Denton County, O'Rourke did 50,000 votes better than Cruz's last opponent. In Collin, he fared almost 70,000 votes better.
But it was "non-metro" area rural county Texans who really saved Cruz and the rest of the statewide Republicans — from Gov. Greg Abbott to Attorney General Ken Paxton to Agriculture Commissioner Sid Miller — from the rising blue tide. The 172 "non-metro" rural counties account for about 12 percent of the state’s vote. Ted Cruz and the rest of the Republican ticket won largely because they pulled 73% of the vote out of the "non-metro" counties, to Beto O'Rourke’s, and the other Democrats’, 26.6 percent.
Texas Democrats’ biggest win on election night was flipping four major state appeals court districts that serve Austin, Houston and Dallas, pushing aside 19 incumbent Republican appellate judges. Democrats now hold majorities on seven of the state’s 14 appeals courts. Before Tuesday, they held seats on just three.
State appeals courts sit between Texas’ scores of trial courts and its two high courts. They are intermediate courts — meaning their rulings can be review by the state’s two high courts, the Texas Supreme Court and the Texas Court of Criminal Appeals, which remain fully in Republican hands.
The appellate courts hear thousands of cases — the Dallas-based 5th Court of Appeals, for example, handled some 1,800 cases during the last fiscal year — while the Supreme Court takes up about 100 cases.
The new justices will generate far more decisions than the state’s two high courts can overturn, even if they want to. And the state’s urban-based courts are — unofficially — considered more influential in setting precedent than the smaller, rural courts.
All appellate judges are bound by the tight restrictions of the law, but the cases that come before them often fall into gray areas between corporate business interests the interests of everyday Texans. Democratic justices are generally considered to be less inclined than Republican justices to overturn jury verdicts, like in cases where victims are awarded top dollar after being harmed by large corporations.
Additionally, in Harris County alone, which is home to Houston and the third-largest county in the United States, Democrats unseated 59 Republican judges — including 23 district judges, 13 family court judges, eight county civil judges and probate judges, and 15 misdemeanor judges. Of the newly appointed Democrats, an unprecedented 17 are black women, significantly changing the face of a judiciary that had been primarily white.
Something’s Happening Collin County
Collin County Democrats’ biggest win on election night was the part they played in flipping Texas' 5th District Court of Appeals. For 19 uninterrupted years, all 13 elected judges on Texas' 5th District Court of Appeals were Republicans, earning a reputation for being one of the most conservative courts in the state.
But that changed dramatically, when voters elected all eight Democrats on the ballot to replace Republicans previously sitting on that appellate court’s bench for six-year terms. Three more are up for re-election in 2020 and the final two will be up for re-election in 2022.
The remaking of this appellate court was the part of Texas' rising blue tide that attracted the least attention, but which yields possibly the greatest benefit to everyday Texans.
The court hears civil, criminal and family appeals cases in Dallas, Collin, Rockwall, Kaufman, Grayson and Hunt counties. All 13 seats on the bench are at-large, meaning voters from Dallas, Collin, Rockwall, Kaufman, Grayson and Hunt counties vote for all of the seats.
Even though Dallas County voters have given Democrats running for this appellate court big vote margin wins for years, the margin was never enough to counter balance their vote losses in the five other conservative-leaning counties, in particular Collin County, the largest by far of the district’s conservative counties. This year, the eight Democratic appellate court candidates lost Collin County by about 15 points, cutting their vote losses to half of Democratic candidate losses in past election years.
Of Texas’ 15 largest counties, Collin County ranks second behind Travis County in the rate of turnout, with 61.4% (357,034) of the County’s 581,684 registered voters casting ballots. The rate of voter turnout in Travis County was 62 percent. Collin County turnout for this midterm was nearly double that of past midterm election cycles, and approaches turnout levels typical for presidential election years.
In 2018, Democrats improved their performance by up to 20 points over candidates who ran in 2014 and by 8 to 10 points over candidates who ran in 2016. In 2014, the Democratic candidate for U.S. Senate received 28 percent of the vote to Sen. John Cornyn's 68.4 percent. This year, Beto O’Rourke, the Democratic candidate for U.S. Senate earned 46.3 percent of the vote to Sen. Ted Cruz's 52.6 percent. In 2016, the top federal Democratic candidate on the ballot, Hillary Clinton received 38 percent of the vote to Donald Trump's 55 percent. In 2014, the Democratic candidate for Governor, Wendy Davis, received 32.6 percent of the vote to Gov. Greg Abbott's 65.7 percent. This year, the Democratic candidate for Governor, Lupe Valdez, received 39 percent of the vote to Gov. Greg Abbott's 58.8 percent. But Valdez under performed every other countywide Democratic candidate on Collin County ballots. The Democratic candidate for Lt. Governor, Mike Collier, received 43.65 percent of the vote to Lt. Gov. Dan Patrick's 54.2 percent.
The southwest quadrant of Collin County has been trending left faster than the other three-quarters of the county, as is apparent in the performance of Democratic candidates for state house districts 66 and 67. Sharon Hirsch, the Democrat for House District 66 in the far southwestern corner of the county was only 391 votes short, out of 70,192 ballots cast, of beating her Republican opponent Matt Shaheen. Sarah Depew, the Democrat for House District 67, which is the next district east of HD66, fell only 1,672 votes short, out of 75,119 ballots cast, of beating her opponent Jeff Leach. Lorie Burch, the Democrat for Congressional District 3, which includes all of House Districts 66 and 67, plus more right-leaning areas of the county also turned in a good performance by earning 44 percent of the vote to her Republican opponent Van Taylor's 54 percent.
The eight Democrats who flipped the 5th District Court of Appeals all earned 42% to 43% percent of the vote in Collin County, which was at least a 10 point better showing than Democrats have turned in for that judicial office this century. That 10+ point better showing this year, combined with their large win margins in Dallas County gave the new Democratic Justices the edge they needed to prevail in the six county district. The eight new appellate court justices are:
- Ken Molberg, who beat sitting Republican Jim Pikl
- Robert Burns, who beat sitting Republican Douglas Lang for chief justice
- Robbie Partida-Kipness, who beat sitting Republican David Evans
- Erin Nowell, who beat sitting Republican Craig Stoddart
- Bill Pedersen, who beat sitting Republican Jason Boatright
- Amanda Reichek, who beat sitting Republican Molly Francis
- Cory Carlyle, who beat Republican John Browning in an open seat
- Leslie Lester Osborne, who beat sitting Republican Elizabeth Lang Mier
| Reg Voter |
Cards Cast |
% Vote |
% SP Rep |
% SP Dem |
Ted REP |
Beto DEM |
Greg REP |
Lupe DEM |
Dan REP |
Mike DEM |
CD 3 REP |
CD 3 DEM |
SD 8 REP |
SD 8 DEM |
HD 66 REP |
HD 66 DEM |
HD 67 REP |
HD 67 DEM |
| 581,684 | 357,034 | 61.38% | 58.19% | 41.30% | 52.65% | 46.53% | 58.83% | 39.35% | 54.17% | 43.65% | 54.25% | 44.23% | 52.25% | 47.75% | 50.29% | 49.71% | 51.15% | 48.85% |
The demographic patterns of Collin County turnout for the 2018 midterm closely matched turnout patterns for the 2016 presidential election, except those patterns have continued to shift left over the past two years.
The key turnout metric to look at is the relative turnout rates among the age cohorts. The chart below shows the ratio of early turnout for 18 to 29 year old voters, compared to the other age cohorts. Turnout for this year's cohort of youngest voters is well above the cohort’s share of the total vote for the entire 2014 midterm election, and is tied with the cohort’s share of the 2016 vote. (The charts below do not include the final by-mail ballots received after election day. The chart will be updated when the data is available.)

It is important to understand and accurately interpret two key data points here: The percentage of registered young people who turnout to vote ballots; and the share of all votes that were cast by young voters in relationship to older voter's. Again, the percentage of registered young people who voted in 2018 closely matches this turnout pattern in the 2016 presidential election.

By earning 48.3 percent of the statewide vote, O’Rourke performed better than any Democrat had in a statewide race in Texas since at least 1994. Even though O’Rourke won just 32 of the state’s 254 counties, O’Rourke’s margins within the state’s booming urban areas, and many suburban areas as well, provide evidence those parts of the state are left-trending.
In Ruy Teixeira’s op-ed “The midterms gave Democrats clear marching orders for 2020,” in The Washington Post, he shows where Democrats succeeded, how they succeeded, where they failed, and how did they fail:
“The Southwestern success formula: Carry or come close to carrying white college graduates; gain strong turnout and support from nonwhites, particularly Latinos; cap the deficits among white non-college-educated voters in the low 20s. Democrats can get away with higher deficits among white non-college-educated voters because the nonwhite share of voters in these states is much higher than in the Midwest…In 2018, this formula worked in Nevada, Colorado, New Mexico and in the Arizona Senate race, with notably strong Latino support, but it failed in the Texas Senate race. Why? O’Rourke also drew strong Latino support, and his performance among white college-educated voters was quite good for a Democrat in Texas. But his deficit among white non-college-educated voters was a disaster: O’Rourke lost these voters by 48 points, according to the exit polls.” In the south, Teixeira notes, “Democrats need to be competitive among white college-educated voters, while avoiding deficits among white non-college-educated voters.”“Beyond the failure of moderates,” writes Vann R. Newkirk in “The Democrats’ Deep-South Strategy Was a Winner After All” in The Atlantic,
“the most compelling evidence for the viability of a progressive strategy comes from farther down the ballot. Across the country, progressive ballot initiatives fared surprisingly well. Indeed, measures against gerrymandering, in favor of medical marijuana, in favor of higher minimum wages, in favor of Medicaid expansion, and in favor of criminal-justice reform received broad bipartisan support in several states, and actually outperformed Democrats running for statewide office. In Florida, even as Gillum conceded early, Amendment 4—a ballot initiative restoring the right to vote to more than 1 million people in Florida who were previously disenfranchised due to felony convictions—passed a 60 percent vote threshold and will become law. Gillum championed that amendment…Medicaid expansion, the main policy foundation of Abrams’s campaign, passed on ballot initiatives in Idaho, Nebraska, and Utah; minimum-wage hikes—part of all three of the Democratic darlings’ platforms—won in Missouri and Arkansas. Voters in Colorado, Michigan, and Missouri moved to take gerrymandering out of the hands of politicians. Other significant criminal-justice reforms passed in Florida and Louisiana…What this means is that though Gillum and O’Rourke may have lost—and Abrams may be on her way—voters across the country, even some in deep-red states, are amenable to the kinds of policies that the Democratic trio championed. And support for these policies is likely even stronger than Tuesday’s results show. Medicaid expansion polls well nationally and in states that haven’t adopted it, as do minimum-wage increases. The mechanisms needed to fund those programs aren’t quite so beloved, but as Tuesday showed, voters are voluntarily choosing to implement progressive reforms and to pay for them.”These are the main lessons Texas Democrats must take away for the the 2018 election cycle to build upon in the 2020 election cycle that started on November 7, 2018.
As Texas Democrats continue to work to make Texas's suburban counties blue, especially Collin and Demton Counties, and rural counties swing counties in 2020, they will be helped by major population growth of more left-leaning voters in and around the state’s largest urban and suburban areas. The rising population of these metro areas will build on the the record 2018 midterm turnout momentum to feed Texas' rising blue tide into 2020 and beyond.
The Collin County government GIS/Rural Addressing mapping department compiled a precinct-by-precinct tally for 22 contests, plus straight-party votes cast and overall turnout. Not ALL races are on the list, but it’s a hefty sampling. Here are Voter Turnout Statistics for Collin County:
- 42,535: New Registered Voters since the 2016 Presidential Election
- 49.68%: of Registered Voters voted early
- 11%: of Registered Voters voted on Election Day #1:
- Collin County had the highest Early Voting Turnout in Texas (Texas Secretary of State's Office – 49.39%)
- 61.38%: Voter Turnout
- 357,034: Total Ballots Cast
- 289,007: Voted Early
- 68,027: Voted on Election Day
- 81%: of ballots cast were cast during Early Voting
- 19%: of ballots cast voted on Election Day
| Date | Total Reg Voters |
Total Votes Cast |
% Reg Voters |
ED Ballots Cast |
Mail Ballots Cast |
EV Ballots Cast |
EV % Cast |
EV % Reg Voters |
| Nov-88 | 122,718 | 91,230 | 74.3% | 71,012 | 1779 | 18,439 | 20.2% | 15% |
| Nov-90 | 122,114 | 71,573 | 58.6% | 58,301 | 1396 | 11,876 | 16.6% | 10% |
| Nov-92 | 153,736 | 128,808 | 83.8% | 83,228 | 2512 | 43,068 | 33.4% | 28% |
| Nov-94 | 175,916 | 98,470 | 56.0% | 64,853 | 1920 | 31,697 | 32.2% | 18% |
| Nov-96 | 231,160 | 132,925 | 57.5% | 79,973 | 2592 | 50,360 | 37.9% | 22% |
| Nov-98 | 263,573 | 84,089 | 31.9% | 58,030 | 1640 | 24,419 | 29.0% | 9% |
| Nov-00 | 300,426 | 177,673 | 59.1% | 100,434 | 1,995 | 75,244 | 42.3% | 25% |
| Nov-02 | 319,236 | 129,792 | 40.7% | 78,770 | 3,510 | 47,512 | 36.6% | 15% |
| Nov-04 | 369,412 | 246,617 | 66.8% | 92,636 | 3,980 | 150,001 | 60.8% | 41% |
| Nov-06 | 381,825 | 138,686 | 36.3% | 76,101 | 1,581 | 60,784 | 43.8% | 16% |
| Nov-08 | 425,994 | 298,647 | 70.1% | 75,359 | 11,916 | 210,895 | 70.6% | 50% |
| Nov-10 | 424,548 | 157,849 | 37.0% | 66,700 | 3,308 | 87,839 | 55.6% | 21% |
| Nov-12 | 462,102 | 304,421 | 65.9% | 80,047 | 10,937 | 213,437 | 70.1% | 46% |
| Nov-14 | 489,032 | 178,672 | 36.5% | 71,952 | 8,750 | 97,960 | 54.8% | 20% |
| Nov-16 | 540,084 | 366,483 | 67.9% | 60,766 | 15,616 | 290,008 | 79.1% | 54% |
| Nov-18 | 581,684 | 357,034 | 61.38% | 66,965 | 18,311 | 271,868 | 76.1% | 46.7% |
Districts in the Southwestern Quadrant of the County
| Pct | Reg Voter |
Cards Cast |
% Vote |
% SP Rep |
% SP Dem |
Ted Rep |
Beto Dem |
Greg Rep |
Lupe Dem |
Dan Rep |
Mike Dem |
CD 3 Rep |
CD 3 Dem |
SD 8 Rep |
SD 8 Dem |
HD 66 Rep |
HD 66 Dem |
HD 67 Rep |
HD 67 Dem |
| Pct | Reg Voter |
Cards Cast |
% Vote |
% SP Rep |
% SP Dem |
Ted Rep |
Beto Dem |
Greg Rep |
Lupe Dem |
Dan Rep |
Mike Dem |
CD 3 Rep |
CD 3 Dem |
SD 8 Rep |
SD 8 Dem |
HD 66 Rep |
HD 66 Dem |
HD 67 Rep |
HD 67 Dem |
| 1 | 2,564 | 1,763 | 69% | 58% | 40% | 49% | 50% | 55% | 42% | 51% | 46% | 53% | 45% | 53% | 47% | - | - | - | - |
| 2 | 4,185 | 2,153 | 51% | 50% | 49% | 47% | 52% | 52% | 46% | 49% | 49% | 49% | 49% | 49% | 51% | - | - | - | - |
| 3 | 2,230 | 876 | 39% | 18% | 82% | 18% | 81% | 21% | 77% | 19% | 78% | 19% | 80% | 20% | 80% | - | - | - | - |
| 4 | 1,384 | 1,023 | 74% | 78% | 20% | 68% | 31% | 73% | 26% | 68% | 29% | 71% | 26% | - | - | - | - | - | - |
| 5 | 1,015 | 761 | 75% | 70% | 28% | 62% | 36% | 68% | 28% | 62% | 34% | 68% | 30% | 65% | 35% | - | - | 69% | 31% |
| 6 | 5,405 | 3,349 | 62% | 52% | 47% | 48% | 51% | 54% | 44% | 48% | 49% | 51% | 48% | 50% | 50% | - | - | - | - |
| 7 | 1,504 | 859 | 57% | 56% | 43% | 49% | 50% | 55% | 42% | 50% | 47% | 52% | 46% | 52% | 48% | - | - | - | - |
| 8 | 2,774 | 1,390 | 50% | 76% | 24% | 72% | 27% | 75% | 24% | 72% | 26% | 73% | 25% | - | - | - | - | - | - |
| 9 | 5,199 | 2,929 | 56% | 60% | 39% | 56% | 43% | 60% | 37% | 57% | 40% | 57% | 40% | - | - | - | - | - | - |
| 10 | 664 | 433 | 65% | 83% | 16% | 78% | 21% | 82% | 16% | 77% | 21% | 79% | 19% | - | - | - | - | - | - |
| 11 | 3,540 | 2,181 | 62% | 81% | 19% | 75% | 24% | 79% | 20% | 75% | 23% | - | - | - | - | - | - | - | - |
| 12 | 2,067 | 1,225 | 59% | 68% | 32% | 62% | 38% | 68% | 30% | 63% | 35% | 64% | 35% | 64% | 36% | - | - | - | - |
| 13 | 3,693 | 2,321 | 63% | 83% | 17% | 74% | 25% | 79% | 19% | 75% | 23% | - | - | - | - | - | - | - | - |
| 14 | 2,688 | 1,656 | 62% | 42% | 58% | 38% | 61% | 46% | 52% | 41% | 57% | 41% | 58% | 43% | 57% | 42% | 58% | - | - |
| 15 | 1,577 | 893 | 57% | 51% | 48% | 46% | 53% | 51% | 47% | 48% | 48% | 48% | 49% | 49% | 51% | 49% | 51% | - | - |
| 16 | 2,617 | 1,656 | 63% | 73% | 27% | 66% | 33% | 71% | 27% | 66% | 31% | 68% | 30% | - | - | - | - | - | - |
| 17 | 2,910 | 1,582 | 54% | 63% | 36% | 59% | 40% | 64% | 35% | 60% | 38% | - | - | - | - | - | - | - | - |
| 18 | 828 | 462 | 56% | 83% | 17% | 79% | 20% | 81% | 18% | 78% | 21% | - | - | - | - | - | - | - | - |
| 19 | 1,588 | 1,092 | 69% | 64% | 36% | 54% | 44% | 62% | 36% | 57% | 40% | 59% | 39% | 58% | 42% | 59% | 41% | - | - |
| 20 | 839 | 564 | 67% | 82% | 18% | 74% | 25% | 79% | 20% | 74% | 23% | - | - | - | - | - | - | - | - |
| 21 | 4,136 | 2,713 | 66% | 54% | 45% | 48% | 51% | 54% | 43% | 49% | 48% | 52% | 47% | 51% | 50% | - | - | 53% | 47% |
| 22 | 3,504 | 2,157 | 62% | 83% | 16% | 79% | 21% | 83% | 16% | 78% | 20% | - | - | - | - | - | - | - | - |
| 23 | 2,398 | 1,209 | 50% | 24% | 75% | 23% | 76% | 28% | 70% | 25% | 73% | 25% | 73% | 27% | 73% | - | - | 26% | 74% |
| 24 | 2,413 | 1,191 | 49% | 34% | 65% | 31% | 69% | 37% | 61% | 32% | 65% | 33% | 66% | 33% | 67% | 33% | 67% | - | - |
| 25 | 4,979 | 3,381 | 68% | 52% | 48% | 48% | 52% | 55% | 43% | 50% | 48% | 51% | 48% | 51% | 50% | - | - | - | - |
| 26 | 1,605 | 979 | 61% | 51% | 49% | 47% | 52% | 52% | 46% | 49% | 49% | 50% | 48% | 49% | 51% | - | - | 49% | 51% |
| 27 | 2,595 | 1,544 | 60% | 57% | 42% | 53% | 46% | 59% | 40% | 55% | 43% | - | - | - | - | - | - | - | - |
| 28 | 2,509 | 1,587 | 63% | 52% | 47% | 46% | 53% | 53% | 45% | 48% | 50% | 50% | 48% | 49% | 51% | 49% | 51% | - | - |
| 29 | 1,416 | 971 | 69% | 73% | 26% | 66% | 33% | 72% | 26% | 68% | 30% | - | - | - | - | - | - | - | - |
| 30 | 5,129 | 3,475 | 68% | 62% | 37% | 55% | 44% | 61% | 36% | 57% | 41% | 59% | 39% | 59% | 41% | - | - | - | - |
| 31 | 2,118 | 1,488 | 70% | 63% | 36% | 55% | 44% | 63% | 34% | 57% | 41% | 59% | 40% | 58% | 42% | 59% | 41% | - | - |
| 32 | 2,498 | 1,659 | 66% | 61% | 39% | 53% | 46% | 60% | 38% | 54% | 44% | 57% | 42% | 54% | 46% | - | - | 57% | 43% |
| 33 | 3,660 | 2,228 | 61% | 78% | 21% | 70% | 29% | 74% | 24% | 71% | 26% | - | - | - | - | - | - | - | - |
| 34 | 4,070 | 2,617 | 64% | 43% | 57% | 39% | 60% | 47% | 51% | 42% | 57% | 43% | 56% | 43% | 57% | 43% | 57% | - | - |
| 35 | 1,445 | 843 | 58% | 85% | 15% | 79% | 20% | 83% | 15% | 79% | 19% | - | - | - | - | - | - | - | - |
| 36 | 1,932 | 1,322 | 68% | 67% | 32% | 59% | 40% | 67% | 31% | 60% | 38% | 63% | 36% | 62% | 38% | 63% | 37% | - | - |
| 37 | 1,987 | 1,107 | 56% | 88% | 11% | 84% | 16% | 86% | 12% | 82% | 16% | - | - | - | - | - | - | - | - |
| 38 | 6,748 | 3,959 | 59% | 50% | 49% | 45% | 54% | 51% | 47% | 47% | 51% | 47% | 51% | 48% | 52% | - | - | - | - |
| 39 | 2,967 | 1,671 | 56% | 44% | 55% | 40% | 59% | 46% | 52% | 42% | 55% | 43% | 56% | 43% | 57% | - | - | 44% | 56% |
| 40 | 3,487 | 2,190 | 63% | 68% | 32% | 62% | 37% | 66% | 31% | 62% | 35% | 64% | 34% | 63% | 37% | - | - | 66% | 34% |
| 41 | 3,330 | 2,306 | 69% | 76% | 23% | 68% | 31% | 74% | 24% | 69% | 29% | 72% | 27% | 72% | 28% | - | - | - | - |
| 42 | 1,531 | 891 | 58% | 77% | 23% | 71% | 28% | 76% | 22% | 71% | 27% | - | - | - | - | - | - | - | - |
| 43 | 5,582 | 3,063 | 55% | 52% | 48% | 47% | 52% | 53% | 45% | 49% | 49% | 50% | 49% | 50% | 50% | - | - | - | - |
| 44 | 1,494 | 698 | 47% | 49% | 51% | 45% | 54% | 50% | 48% | 46% | 51% | 48% | 50% | 47% | 53% | - | - | - | - |
| 45 | 2,584 | 1,647 | 64% | 65% | 35% | 60% | 39% | 65% | 34% | 60% | 38% | 63% | 36% | 62% | 38% | - | - | - | - |
| 46 | 2,983 | 1,496 | 50% | 40% | 59% | 37% | 62% | 41% | 57% | 38% | 59% | 39% | 59% | 39% | 61% | - | - | 40% | 60% |
| 47 | 2,592 | 1,590 | 61% | 53% | 46% | 47% | 52% | 52% | 45% | 47% | 50% | 50% | 48% | 49% | 51% | - | - | - | - |
| 48 | 3,285 | 2,186 | 67% | 53% | 46% | 47% | 53% | 54% | 44% | 49% | 49% | 50% | 49% | 50% | 50% | - | - | 51% | 49% |
| 49 | 2,303 | 1,533 | 67% | 66% | 34% | 57% | 42% | 65% | 34% | 59% | 40% | 61% | 38% | 59% | 41% | - | - | 62% | 38% |
| 50 | 3,023 | 1,498 | 50% | 30% | 70% | 28% | 71% | 33% | 65% | 30% | 67% | 31% | 68% | 31% | 70% | - | - | 31% | 69% |
| 51 | 1,651 | 838 | 51% | 32% | 67% | 32% | 67% | 34% | 62% | 33% | 63% | 33% | 64% | 34% | 66% | - | - | 35% | 65% |
| 52 | 3,661 | 2,068 | 56% | 30% | 70% | 29% | 70% | 34% | 64% | 31% | 67% | 31% | 67% | 32% | 68% | - | - | - | - |
| 53 | 2,177 | 1,523 | 70% | 63% | 37% | 54% | 45% | 61% | 37% | 55% | 41% | 58% | 40% | 56% | 44% | - | - | 59% | 41% |
| 54 | 3,126 | 1,708 | 55% | 40% | 59% | 38% | 61% | 42% | 55% | 39% | 58% | 39% | 58% | 40% | 60% | - | - | 41% | 59% |
| 55 | 3,458 | 2,163 | 63% | 41% | 58% | 35% | 64% | 43% | 55% | 37% | 59% | 39% | 59% | 39% | 61% | - | - | 41% | 59% |
| 56 | 5,539 | 3,326 | 60% | 65% | 35% | 58% | 41% | 64% | 34% | 60% | 38% | - | - | - | - | - | - | - | - |
| 57 | 4,446 | 2,516 | 57% | 57% | 42% | 53% | 46% | 58% | 40% | 54% | 43% | 55% | 43% | 55% | 45% | - | - | - | - |
| 58 | 3,601 | 2,032 | 56% | 49% | 50% | 45% | 54% | 51% | 47% | 47% | 51% | 48% | 50% | 48% | 52% | - | - | 49% | 51% |
| 59 | 3,907 | 2,345 | 60% | 62% | 38% | 56% | 44% | 61% | 37% | 57% | 41% | 58% | 40% | 58% | 42% | - | - | - | - |
| 60 | 2,193 | 1,504 | 69% | 76% | 23% | 68% | 31% | 74% | 24% | 70% | 29% | 72% | 27% | 70% | 30% | - | - | - | - |
| 61 | 1,697 | 1,143 | 67% | 61% | 39% | 56% | 43% | 62% | 37% | 58% | 40% | 60% | 39% | 57% | 43% | - | - | - | - |
| 62 | 2,510 | 1,548 | 62% | 53% | 47% | 44% | 54% | 51% | 47% | 46% | 51% | 48% | 50% | 47% | 53% | - | - | 49% | 51% |
| 63 | 1,978 | 1,428 | 72% | 65% | 35% | 57% | 42% | 63% | 35% | 58% | 40% | 62% | 37% | 59% | 41% | - | - | 62% | 38% |
| 64 | 2,667 | 1,617 | 61% | 51% | 49% | 46% | 53% | 54% | 44% | 48% | 50% | 50% | 48% | 48% | 52% | - | - | 50% | 50% |
| 65 | 1,232 | 746 | 61% | 56% | 43% | 51% | 48% | 56% | 42% | 52% | 46% | 53% | 44% | 52% | 48% | - | - | 53% | 47% |
| 66 | 2,118 | 1,280 | 60% | 54% | 46% | 49% | 50% | 54% | 44% | 50% | 48% | 52% | 47% | 51% | 49% | - | - | 53% | 47% |
| 67 | 2,485 | 1,574 | 63% | 56% | 43% | 48% | 51% | 54% | 44% | 51% | 47% | 51% | 47% | 51% | 49% | 51% | 49% | - | - |
| 68 | 1,981 | 1,143 | 58% | 51% | 48% | 49% | 50% | 52% | 46% | 49% | 48% | 51% | 47% | 50% | 50% | - | - | - | - |
| 69 | 3,772 | 2,498 | 66% | 57% | 43% | 50% | 49% | 57% | 41% | 52% | 46% | 53% | 45% | 52% | 48% | - | - | 54% | 46% |
| 70 | 1,894 | 1,287 | 68% | 67% | 33% | 56% | 42% | 64% | 34% | 58% | 40% | 60% | 38% | 59% | 41% | - | - | 61% | 39% |
| 71 | 1,770 | 1,200 | 68% | 55% | 44% | 50% | 50% | 55% | 43% | 51% | 47% | 53% | 45% | 51% | 49% | 52% | 48% | - | - |
| 72 | 1,533 | 971 | 63% | 58% | 41% | 54% | 44% | 61% | 37% | 55% | 42% | 56% | 42% | 56% | 44% | - | - | 58% | 42% |
| 73 | 1,829 | 1,015 | 55% | 40% | 59% | 35% | 64% | 42% | 55% | 38% | 60% | 37% | 61% | 38% | 62% | 39% | 61% | - | - |
| 74 | 1,856 | 1,160 | 63% | 55% | 44% | 49% | 50% | 54% | 44% | 50% | 48% | 51% | 47% | 51% | 49% | 52% | 48% | - | - |
| 75 | 1,922 | 1,288 | 67% | 66% | 33% | 61% | 39% | 67% | 31% | 61% | 37% | 65% | 34% | 61% | 39% | 64% | 36% | - | - |
| 76 | 3,292 | 2,206 | 67% | 58% | 41% | 53% | 47% | 60% | 38% | 54% | 43% | 56% | 43% | 54% | 46% | 55% | 45% | - | - |
| 77 | 3,569 | 2,076 | 58% | 45% | 54% | 42% | 58% | 49% | 50% | 44% | 54% | 44% | 54% | 44% | 56% | - | - | 45% | 55% |
| 78 | 2,724 | 1,788 | 66% | 51% | 48% | 45% | 54% | 51% | 46% | 46% | 51% | 48% | 49% | 48% | 52% | - | - | 49% | 51% |
| 79 | 2,623 | 1,451 | 55% | 56% | 44% | 49% | 51% | 56% | 42% | 51% | 47% | 51% | 48% | 52% | 48% | 52% | 48% | - | - |
| 80 | 3,494 | 2,104 | 60% | 55% | 44% | 50% | 50% | 55% | 43% | 50% | 47% | 52% | 46% | 52% | 48% | - | - | - | - |
| 81 | 2,870 | 1,758 | 61% | 50% | 49% | 42% | 57% | 49% | 48% | 44% | 53% | 45% | 53% | 44% | 56% | 45% | 55% | - | - |
| 82 | 2,653 | 1,484 | 56% | 55% | 44% | 48% | 51% | 55% | 43% | 51% | 46% | 51% | 47% | 52% | 48% | - | - | - | - |
| 83 | 4,906 | 2,850 | 58% | 70% | 30% | 64% | 35% | 69% | 29% | 66% | 32% | - | - | - | - | - | - | - | - |
| 84 | 2,405 | 1,492 | 62% | 57% | 43% | 49% | 50% | 56% | 43% | 51% | 47% | 53% | 46% | 52% | 48% | 53% | 47% | - | - |
| 85 | 3,054 | 1,831 | 60% | 49% | 51% | 43% | 56% | 49% | 49% | 44% | 53% | 45% | 53% | 45% | 55% | - | - | 46% | 54% |
| 86 | 2,805 | 1,824 | 65% | 56% | 44% | 51% | 48% | 58% | 40% | 51% | 45% | 54% | 45% | 53% | 47% | 54% | 46% | - | - |
| 87 | 5,753 | 3,876 | 67% | 46% | 54% | 43% | 56% | 51% | 48% | 46% | 52% | 46% | 53% | 47% | 53% | - | - | - | - |
| 88 | 2,420 | 1,079 | 45% | 25% | 74% | 23% | 76% | 29% | 68% | 24% | 72% | 24% | 74% | 26% | 74% | 25% | 75% | - | - |
| 89 | 5,037 | 3,125 | 62% | 48% | 51% | 45% | 54% | 53% | 46% | 47% | 51% | 49% | 50% | 48% | 52% | 49% | 51% | - | - |
| 90 | 3,199 | 2,119 | 66% | 67% | 33% | 60% | 40% | 68% | 30% | 61% | 37% | 65% | 34% | 62% | 38% | 64% | 36% | - | - |
| 91 | 2,268 | 1,436 | 63% | 56% | 43% | 48% | 51% | 55% | 42% | 49% | 48% | 51% | 47% | 51% | 49% | - | - | 53% | 47% |
| 92 | 3,401 | 1,757 | 52% | 51% | 48% | 46% | 53% | 52% | 46% | 47% | 49% | 49% | 49% | 49% | 51% | - | - | - | - |
| 93 | 263 | 151 | 57% | 93% | 7% | 84% | 15% | 90% | 10% | 85% | 14% | - | - | - | - | - | - | - | - |
| 94 | 3,791 | 2,574 | 68% | 48% | 51% | 44% | 56% | 52% | 47% | 46% | 53% | 47% | 52% | 46% | 54% | - | - | 48% | 52% |
| 95 | 2,971 | 1,881 | 63% | 51% | 48% | 46% | 53% | 52% | 46% | 47% | 50% | 49% | 49% | 49% | 51% | - | - | - | - |
| 96 | 1,764 | 601 | 34% | 45% | 53% | 44% | 55% | 48% | 49% | 45% | 52% | 45% | 53% | 46% | 54% | - | - | - | - |
| 97 | 1,332 | 975 | 73% | 80% | 20% | 71% | 29% | 78% | 21% | 71% | 27% | 74% | 25% | 71% | 29% | - | - | - | - |
| 98 | 1,205 | 718 | 60% | 66% | 33% | 60% | 40% | 67% | 32% | 62% | 37% | 63% | 35% | 62% | 38% | - | - | - | - |
| 99 | 295 | 145 | 49% | 51% | 49% | 46% | 52% | 51% | 46% | 49% | 47% | 48% | 50% | 52% | 48% | - | - | - | - |
| 100 | 30 | 11 | 37% | 67% | 33% | 73% | 27% | 73% | 27% | 73% | 27% | 70% | 30% | - | - | - | - | - | - |
| 101 | 3,341 | 2,143 | 64% | 57% | 43% | 50% | 49% | 57% | 41% | 53% | 45% | 53% | 45% | 53% | 47% | - | - | - | - |
| 102 | 2,563 | 1,747 | 68% | 74% | 25% | 65% | 34% | 72% | 26% | 66% | 31% | 69% | 29% | 67% | 33% | - | - | - | - |
| 103 | 1,285 | 676 | 53% | 42% | 57% | 39% | 60% | 44% | 54% | 40% | 57% | 41% | 57% | 40% | 60% | - | - | - | - |
| 104 | 2,738 | 1,180 | 43% | 29% | 71% | 27% | 72% | 32% | 66% | 28% | 69% | 29% | 69% | 29% | 71% | 30% | 70% | - | - |
| 105 | 1,181 | 726 | 61% | 61% | 39% | 54% | 46% | 61% | 39% | 56% | 42% | 59% | 40% | 56% | 44% | 58% | 42% | - | - |
| 106 | 1,918 | 1,163 | 61% | 56% | 42% | 51% | 48% | 56% | 42% | 52% | 45% | 53% | 44% | 52% | 48% | - | - | - | - |
| 107 | 3,341 | 2,148 | 64% | 51% | 49% | 47% | 53% | 54% | 44% | 49% | 49% | 50% | 49% | 49% | 51% | - | - | 51% | 49% |
| 108 | 2,889 | 1,797 | 62% | 49% | 50% | 43% | 56% | 52% | 47% | 46% | 52% | 47% | 52% | 46% | 54% | 46% | 54% | - | - |
| 109 | 3,525 | 2,280 | 65% | 61% | 39% | 53% | 46% | 61% | 37% | 56% | 42% | 58% | 41% | 57% | 43% | 58% | 43% | - | - |
| 110 | 2,732 | 1,749 | 64% | 58% | 42% | 50% | 49% | 57% | 41% | 53% | 45% | 54% | 45% | 53% | 47% | - | - | 55% | 45% |
| 111 | 4,806 | 2,841 | 59% | 65% | 35% | 58% | 42% | 65% | 34% | 60% | 38% | 61% | 38% | 61% | 39% | - | - | - | - |
| 112 | 2,866 | 1,906 | 67% | 56% | 44% | 49% | 50% | 58% | 40% | 52% | 47% | 53% | 46% | 53% | 47% | 53% | 47% | - | - |
| 113 | 3,314 | 1,839 | 55% | 53% | 47% | 50% | 49% | 55% | 43% | 51% | 46% | 52% | 46% | 52% | 48% | - | - | - | - |
| 114 | 1,337 | 872 | 65% | 80% | 20% | 74% | 26% | 79% | 20% | 76% | 22% | 76% | 22% | - | - | - | - | - | - |
| 115 | 2,923 | 1,944 | 67% | 51% | 48% | 45% | 54% | 53% | 46% | 46% | 52% | 48% | 50% | 47% | 53% | 48% | 52% | - | - |
| 116 | 4,579 | 3,038 | 66% | 58% | 42% | 52% | 47% | 60% | 39% | 55% | 44% | 57% | 42% | 55% | 45% | 56% | 44% | - | - |
| 117 | 4,217 | 2,364 | 56% | 54% | 46% | 48% | 51% | 54% | 44% | 50% | 48% | 51% | 47% | 51% | 49% | - | - | - | - |
| 118 | 4,322 | 2,618 | 61% | 66% | 34% | 58% | 42% | 65% | 33% | 60% | 38% | 62% | 37% | 62% | 38% | - | - | - | - |
| 119 | 5,128 | 3,476 | 68% | 56% | 43% | 51% | 49% | 58% | 40% | 53% | 46% | 55% | 44% | 53% | 47% | 54% | 46% | - | - |
| 120 | 3,447 | 2,260 | 66% | 63% | 36% | 55% | 44% | 64% | 35% | 57% | 41% | 60% | 39% | 58% | 42% | - | - | 62% | 38% |
| 121 | 2,599 | 1,706 | 66% | 35% | 65% | 33% | 66% | 41% | 58% | 36% | 62% | 36% | 63% | 36% | 64% | - | - | 36% | 64% |
| 122 | 4,746 | 3,108 | 65% | 74% | 26% | 65% | 34% | 71% | 27% | 66% | 31% | 69% | 30% | 67% | 33% | - | - | - | - |
| 123 | 2,050 | 1,298 | 63% | 59% | 41% | 54% | 46% | 61% | 38% | 56% | 43% | 57% | 42% | 57% | 43% | 57% | 43% | - | - |
| 124 | 3,090 | 1,796 | 58% | 53% | 47% | 46% | 53% | 53% | 45% | 48% | 50% | 49% | 49% | 48% | 52% | 49% | 51% | - | - |
| 125 | 4,753 | 3,015 | 63% | 45% | 54% | 41% | 58% | 48% | 50% | 43% | 55% | 44% | 55% | 44% | 56% | - | - | 45% | 55% |
| 126 | 4,363 | 2,641 | 61% | 58% | 42% | 51% | 48% | 58% | 40% | 53% | 45% | 54% | 44% | 54% | 46% | - | - | - | - |
| 127 | 3,718 | 2,153 | 58% | 54% | 46% | 48% | 51% | 54% | 44% | 50% | 48% | 51% | 47% | 51% | 49% | - | - | - | - |
| 128 | 4,634 | 3,201 | 69% | 80% | 20% | 72% | 27% | 78% | 21% | 71% | 27% | 75% | 23% | 74% | 26% | - | - | - | - |
| 129 | 3,998 | 2,301 | 58% | 58% | 41% | 53% | 46% | 59% | 40% | 55% | 44% | 56% | 43% | 55% | 45% | - | - | - | - |
| 130 | 3,417 | 2,257 | 66% | 49% | 50% | 45% | 54% | 52% | 46% | 47% | 50% | 48% | 50% | 48% | 52% | - | - | 50% | 50% |
| 131 | 5,681 | 3,546 | 62% | 67% | 33% | 61% | 38% | 67% | 32% | 62% | 36% | 63% | 35% | 62% | 38% | - | - | - | - |
| 132 | 2,807 | 1,747 | 62% | 50% | 50% | 44% | 56% | 51% | 48% | 46% | 52% | 47% | 52% | 46% | 54% | 47% | 53% | - | - |
| 133 | 2,531 | 1,318 | 52% | 54% | 45% | 50% | 49% | 56% | 42% | 52% | 45% | - | - | - | - | - | - | - | - |
| 134 | 4,811 | 2,937 | 61% | 49% | 51% | 44% | 56% | 51% | 48% | 47% | 51% | 47% | 52% | 48% | 52% | - | - | - | - |
| 135 | 4,027 | 2,369 | 59% | 48% | 51% | 44% | 56% | 51% | 47% | 45% | 53% | 46% | 52% | 47% | 53% | 47% | 53% | - | - |
| 136 | 1,932 | 1,291 | 67% | 60% | 40% | 54% | 46% | 60% | 39% | 54% | 45% | 56% | 43% | 55% | 45% | 56% | 44% | - | - |
| 137 | 1,921 | 1,262 | 66% | 61% | 39% | 55% | 45% | 63% | 36% | 57% | 42% | 60% | 39% | 58% | 42% | 59% | 41% | - | - |
| 138 | 1,240 | 912 | 74% | 70% | 29% | 59% | 40% | 68% | 30% | 61% | 37% | 64% | 34% | 62% | 38% | - | - | 64% | 36% |
| 139 | 4,325 | 2,473 | 57% | 45% | 54% | 41% | 59% | 47% | 51% | 43% | 55% | 43% | 55% | 43% | 57% | 44% | 56% | - | - |
| 140 | 4,607 | 2,845 | 62% | 73% | 27% | 65% | 34% | 71% | 28% | 66% | 32% | 67% | 31% | 67% | 34% | - | - | - | - |
| 141 | 3,003 | 2,084 | 69% | 54% | 46% | 47% | 52% | 55% | 43% | 49% | 49% | 52% | 47% | 50% | 50% | - | - | - | - |
| 142 | 2,895 | 1,888 | 65% | 55% | 45% | 46% | 53% | 54% | 44% | 48% | 50% | 49% | 50% | 49% | 51% | 50% | 50% | - | - |
| 143 | 1,805 | 1,278 | 71% | 66% | 34% | 59% | 41% | 66% | 32% | 61% | 38% | 62% | 37% | 60% | 40% | 62% | 38% | - | - |
| 144 | 2,565 | 1,680 | 66% | 58% | 42% | 54% | 46% | 59% | 40% | 55% | 43% | 56% | 42% | 56% | 44% | - | - | - | - |
| 145 | 1,593 | 969 | 61% | 48% | 51% | 44% | 55% | 49% | 49% | 43% | 54% | 46% | 52% | 45% | 55% | - | - | - | - |
| 146 | 4,600 | 2,643 | 57% | 52% | 47% | 47% | 52% | 53% | 45% | 49% | 48% | 50% | 48% | 50% | 50% | - | - | - | - |
| 147 | 1,799 | 1,031 | 57% | 54% | 46% | 50% | 50% | 52% | 46% | 50% | 48% | 50% | 49% | 50% | 50% | - | - | 52% | 48% |
| 148 | 0 | 2 | - | - | - | 0% | 100% | 0% | 100% | 0% | 100% | 0% | 100% | 0% | 100% | - | - | - | - |
| 149 | 3,969 | 2,464 | 62% | 60% | 40% | 55% | 44% | 60% | 38% | 56% | 42% | 57% | 41% | 57% | 43% | - | - | - | - |
| 150 | 921 | 640 | 69% | 62% | 38% | 58% | 42% | 63% | 36% | 59% | 39% | 60% | 39% | - | - | - | - | - | - |
| 151 | 1,586 | 956 | 60% | 45% | 54% | 43% | 56% | 50% | 49% | 43% | 54% | 47% | 52% | 45% | 55% | - | - | - | - |
| 152 | 118 | 50 | 42% | 21% | 79% | 24% | 76% | 31% | 69% | 25% | 73% | 26% | 74% | 23% | 77% | - | - | 24% | 76% |
| 153 | 4,274 | 2,986 | 70% | 57% | 42% | 52% | 47% | 58% | 40% | 54% | 44% | - | - | 56% | 44% | - | - | - | - |
| 154 | 904 | 570 | 63% | 92% | 8% | 85% | 14% | 89% | 10% | 85% | 13% | - | - | - | - | - | - | - | - |
| 155 | 2,510 | 1,537 | 61% | 61% | 38% | 55% | 44% | 62% | 36% | 58% | 40% | 58% | 40% | 59% | 41% | - | - | - | - |
| 156 | 3,514 | 2,080 | 59% | 59% | 41% | 54% | 46% | 59% | 39% | 55% | 43% | 56% | 43% | 56% | 44% | - | - | - | - |
| 157 | 3,495 | 2,338 | 67% | 51% | 49% | 47% | 52% | 54% | 45% | 50% | 48% | 50% | 49% | 50% | 50% | - | - | 51% | 49% |
| 158 | 2,476 | 1,529 | 62% | 45% | 55% | 42% | 57% | 48% | 50% | 43% | 55% | 45% | 54% | 44% | 56% | - | - | - | - |
| 159 | 4,992 | 2,833 | 57% | 48% | 52% | 45% | 54% | 51% | 48% | 47% | 51% | - | - | 48% | 52% | - | - | - | - |
| 160 | 316 | 224 | 71% | 92% | 8% | 86% | 13% | 90% | 9% | 85% | 14% | - | - | - | - | - | - | - | - |
| 161 | 261 | 192 | 74% | 75% | 23% | 63% | 34% | 66% | 33% | 63% | 33% | - | - | - | - | - | - | - | - |
| 162 | 258 | 171 | 66% | 89% | 11% | 84% | 16% | 89% | 11% | 85% | 14% | - | - | - | - | - | - | - | - |
| 163 | 3,513 | 2,174 | 62% | 56% | 44% | 49% | 50% | 55% | 43% | 50% | 47% | 52% | 46% | 52% | 48% | - | - | - | - |
| 164 | 1,050 | 811 | 77% | 68% | 32% | 60% | 40% | 68% | 31% | 59% | 40% | 65% | 35% | 59% | 41% | - | - | 65% | 35% |
| 165 | 886 | 618 | 70% | 70% | 30% | 61% | 38% | 67% | 31% | 61% | 36% | 64% | 35% | 63% | 37% | - | - | - | - |
| 166 | 3,628 | 2,357 | 65% | 53% | 47% | 50% | 49% | 56% | 43% | 52% | 47% | 53% | 46% | 53% | 47% | - | - | - | - |
| 167 | 4,483 | 2,851 | 64% | 45% | 55% | 40% | 59% | 48% | 50% | 43% | 54% | 44% | 55% | 44% | 56% | 44% | 56% | - | - |
| 168 | 1,807 | 1,178 | 65% | 74% | 25% | 65% | 34% | 72% | 26% | 64% | 33% | 68% | 30% | 68% | 32% | - | - | - | - |
| 169 | 2,869 | 1,800 | 63% | 51% | 48% | 46% | 53% | 52% | 46% | 49% | 49% | 49% | 50% | 49% | 51% | - | - | - | - |
| 170 | 1,727 | 1,050 | 61% | 69% | 31% | 61% | 38% | 66% | 31% | 61% | 36% | - | - | - | - | - | - | - | - |
| 171 | 4,790 | 2,941 | 61% | 56% | 44% | 51% | 49% | 58% | 40% | 52% | 46% | 55% | 44% | 54% | 46% | - | - | 56% | 44% |
| 172 | 3,146 | 1,748 | 56% | 67% | 32% | 63% | 36% | 66% | 32% | 64% | 33% | 64% | 34% | - | - | - | - | - | - |
| 173 | 634 | 425 | 67% | 77% | 22% | 67% | 33% | 70% | 27% | 67% | 31% | 69% | 30% | 67% | 33% | - | - | - | - |
| 174 | 3,961 | 2,257 | 57% | 57% | 42% | 54% | 45% | 57% | 41% | 55% | 43% | - | - | - | - | - | - | - | - |
| 175 | 1,560 | 1,013 | 65% | 64% | 36% | 60% | 39% | 65% | 33% | 62% | 36% | 62% | 36% | 62% | 38% | - | - | - | - |
| 176 | 3,785 | 1,716 | 45% | 41% | 58% | 36% | 63% | 43% | 55% | 38% | 59% | 38% | 59% | 40% | 60% | 40% | 60% | - | - |
| 177 | 4,587 | 2,409 | 53% | 59% | 40% | 52% | 47% | 58% | 40% | 53% | 44% | 55% | 44% | 55% | 45% | - | - | - | - |
| 178 | 2,161 | 1,283 | 59% | 80% | 20% | 74% | 25% | 78% | 20% | 73% | 25% | 76% | 23% | - | - | - | - | - | - |
| 179 | 4,522 | 3,333 | 74% | 82% | 17% | 72% | 27% | 78% | 20% | 72% | 26% | 76% | 23% | 73% | 27% | - | - | - | - |
| 180 | 605 | 301 | 50% | 65% | 33% | 60% | 38% | 65% | 32% | 60% | 36% | - | - | - | - | - | - | - | - |
| 181 | 1,556 | 864 | 56% | 66% | 34% | 63% | 36% | 66% | 32% | 64% | 35% | - | - | - | - | - | - | - | - |
| 182 | 0 | 4 | - | 50% | 50% | 50% | 50% | 50% | 50% | 50% | 50% | 25% | 50% | - | - | - | - | - | - |
| 183 | 100 | 57 | 57% | 86% | 14% | 84% | 16% | 81% | 14% | 82% | 14% | 84% | 12% | - | - | - | - | - | - |
| 184 | 0 | 0 | - | - | - | - | - | - | - | - | - | - | - | - | - | - | - | - | - |
| 185 | 45 | 33 | 73% | 61% | 39% | 58% | 42% | 55% | 39% | 52% | 45% | 55% | 42% | - | - | - | - | - | - |
| 186 | 109 | 61 | 56% | 91% | 9% | 89% | 11% | 92% | 8% | 88% | 10% | 92% | 7% | - | - | - | - | - | - |
| 187 | 475 | 282 | 59% | 92% | 8% | 86% | 13% | 90% | 9% | 87% | 11% | 87% | 12% | - | - | - | - | - | - |
| 188 | 59 | 40 | 68% | 88% | 12% | 85% | 15% | 85% | 13% | 88% | 13% | 85% | 10% | - | - | - | - | - | - |
| 189 | 742 | 425 | 57% | 91% | 9% | 86% | 14% | 88% | 11% | 84% | 14% | 86% | 12% | - | - | - | - | - | - |
| 190 | 83 | 45 | 54% | 87% | 10% | 79% | 19% | 84% | 9% | 82% | 13% | - | - | - | - | - | - | - | - |
| 191 | 440 | 204 | 46% | 84% | 16% | 78% | 22% | 81% | 18% | 81% | 18% | 80% | 19% | - | - | - | - | - | - |
| 192 | 1,727 | 968 | 56% | 83% | 17% | 77% | 22% | 80% | 19% | 77% | 22% | - | - | - | - | - | - | - | - |
| 193 | 871 | 488 | 56% | 85% | 15% | 79% | 20% | 81% | 17% | 78% | 18% | 79% | 19% | - | - | - | - | - | - |
| 194 | 23 | 17 | 74% | 82% | 18% | 82% | 18% | 76% | 24% | 80% | 20% | 82% | 18% | - | - | - | - | - | - |
| 195 | 832 | 537 | 65% | 85% | 14% | 78% | 20% | 82% | 16% | 78% | 18% | 81% | 15% | - | - | - | - | - | - |
| 196 | 1,723 | 1,033 | 60% | 62% | 37% | 56% | 42% | 63% | 35% | 58% | 39% | - | - | 60% | 40% | - | - | - | - |
| 197 | 1,238 | 739 | 60% | 41% | 59% | 38% | 61% | 45% | 53% | 41% | 57% | 41% | 57% | 41% | 59% | 42% | 58% | - | - |
| 198 | 117 | 78 | 67% | 73% | 27% | 78% | 22% | 79% | 21% | 77% | 23% | 78% | 21% | - | - | - | - | - | - |
| 199 | 1,376 | 877 | 64% | 81% | 19% | 74% | 26% | 79% | 19% | 73% | 25% | 75% | 23% | - | - | - | - | - | - |
| 200 | 0 | 3 | - | 50% | 50% | 67% | 33% | 67% | 33% | 67% | 33% | - | - | - | - | - | - | - | - |
| 201 | 0 | 3 | - | 100% | 0% | 67% | 33% | 67% | 33% | 67% | 33% | 67% | 33% | - | - | - | - | - | - |
| 202 | 0 | 8 | - | 50% | 50% | 63% | 38% | 63% | 38% | 63% | 38% | - | - | - | - | - | - | - | - |
| 203 | 3,015 | 1,963 | 65% | 72% | 28% | 63% | 36% | 70% | 28% | 66% | 32% | 67% | 31% | 66% | 34% | - | - | - | - |
| 204 | 304 | 236 | 78% | 72% | 28% | 61% | 37% | 70% | 29% | 64% | 34% | 65% | 34% | 66% | 34% | - | - | - | - |
| 205 | 34 | 17 | 50% | 92% | 8% | 82% | 18% | 94% | 6% | 76% | 18% | 82% | 18% | 82% | 18% | - | - | - | - |
| 206 | 1,548 | 950 | 61% | 70% | 30% | 62% | 38% | 69% | 31% | 64% | 35% | 65% | 35% | 65% | 35% | - | - | - | - |
| 207 | 3,647 | 2,182 | 60% | 62% | 38% | 57% | 42% | 62% | 36% | 58% | 40% | 59% | 39% | - | - | - | - | - | - |
| 208 | 1,213 | 862 | 71% | 75% | 25% | 65% | 34% | 73% | 26% | 67% | 31% | 69% | 30% | - | - | - | - | - | - |
| 209 | 688 | 466 | 68% | 58% | 42% | 54% | 46% | 61% | 38% | 55% | 42% | 54% | 44% | 55% | 45% | - | - | - | - |
| 210 | 1,427 | 987 | 69% | 44% | 55% | 41% | 58% | 47% | 51% | 43% | 55% | 43% | 56% | 44% | 56% | - | - | - | - |
| 211 | 5,973 | 3,449 | 58% | 56% | 43% | 49% | 50% | 56% | 43% | 51% | 47% | 52% | 46% | 53% | 47% | - | - | - | - |
| 212 | 2,993 | 2,080 | 70% | 47% | 53% | 44% | 55% | 52% | 46% | 47% | 51% | 47% | 52% | 47% | 53% | - | - | - | - |
| 213 | 3,066 | 1,873 | 61% | 53% | 46% | 47% | 52% | 54% | 44% | 50% | 48% | 50% | 49% | 51% | 49% | - | - | - | - |
| 214 | 3,322 | 2,180 | 66% | 84% | 16% | 76% | 23% | 82% | 17% | 78% | 21% | 80% | 20% | - | - | - | - | - | - |
| 215 | 2,060 | 1,010 | 49% | 71% | 29% | 67% | 32% | 70% | 28% | 67% | 31% | 69% | 30% | - | - | - | - | - | - |
| 216 | 4,572 | 2,787 | 61% | 74% | 26% | 68% | 31% | 73% | 26% | 68% | 30% | 70% | 29% | - | - | - | - | - | - |
| 217 | 1,809 | 1,074 | 59% | 69% | 31% | 62% | 37% | 67% | 31% | 62% | 35% | - | - | - | - | - | - | - | - |
| 218 | 3,172 | 2,071 | 65% | 54% | 45% | 49% | 51% | 57% | 42% | 51% | 47% | 52% | 47% | 52% | 48% | - | - | 54% | 46% |
| 219 | 2,338 | 1,585 | 68% | 62% | 37% | 54% | 45% | 62% | 37% | 56% | 42% | 58% | 42% | 57% | 43% | - | - | 59% | 41% |
| 220 | 2,881 | 1,778 | 62% | 46% | 54% | 44% | 56% | 50% | 49% | 46% | 52% | 46% | 53% | 46% | 54% | - | - | - | - |
| 221 | 4,527 | 2,768 | 61% | 71% | 28% | 64% | 36% | 70% | 28% | 65% | 33% | 66% | 33% | 65% | 35% | - | - | - | - |
| 222 | 2,738 | 1,830 | 67% | 49% | 50% | 46% | 54% | 53% | 45% | 47% | 51% | 48% | 50% | 48% | 52% | - | - | 50% | 50% |
| 223 | 1,722 | 1,176 | 68% | 62% | 38% | 55% | 45% | 64% | 34% | 58% | 40% | 60% | 39% | 59% | 41% | - | - | 61% | 39% |
| 224 | 5,579 | 3,454 | 62% | 78% | 21% | 71% | 28% | 77% | 22% | 73% | 26% | 74% | 25% | - | - | - | - | - | - |
| 225 | 3,367 | 2,093 | 62% | 46% | 54% | 43% | 56% | 51% | 48% | 46% | 52% | 46% | 53% | 46% | 54% | - | - | - | - |
| 226 | 4,202 | 2,444 | 58% | 54% | 45% | 49% | 50% | 55% | 43% | 51% | 47% | 51% | 47% | 51% | 49% | - | - | - | - |
| TL | 581,684 | 357,034 | 61% | 58% | 41% | 53% | 47% | 59% | 39% | 54% | 44% | 54% | 44% | 52% | 48% | 50% | 50% | 51% | 49% |
No comments:
Post a Comment