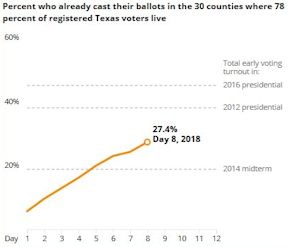
As of Monday, day eight of early voting, 3,354,029 Texans have cast in-person and by-mail in ballots in the 30 counties where most registered voters in the state — 78 percent — live. That preliminary turnout has surpassed the total votes cast in those counties during the entire two-week early voting period in the last midterm election in 2014. So far this year, 27.4 percent of the 12.26 million registered voters in those 30 counties have voted.
We still have too little data to predict the specific election outcomes or the long-term effect of this unprecedented outpouring of voter interest, but we know for certain that Texans are fired up and ready to vote. This state generally sees fewer than 39 percent of registered voters regularly participating in midterm elections.
Voter participation in this year is nearly three times that of the 2014 midterm and is near the pace set during the 2016 presidential election. assuming turnout will continue at the pace set during early voting, total turnout for this election will likely top 60 percent of record high number of registered voters
Historically, midterms have been viewed as a referendum on the party occupying the White House. This political axiom seems magnified this year as Donald Trump has made every effort to nationalize this midterm. Trump’s name is not on the ballot, but the president clearly is casting a big shadow on this election.
The impact the president is having on this election is clear and cannot be overstated. Recent NPR poll data indicate Trump is a significant factor for nearly two-thirds of voters, who are being driven to the polls in part to vote for or against the president. Many deride the polarization of our current politics, but that sharp split has also contributed to Americans’ dramatic increase in political interest.
This new political passion has also fueled a dramatic rise in the number of contested and competitive races across Texas, which in turn has fired up voter interest. Texas has been a one-party state dominated by Republicans for more than two decades, with competitive races largely reserved for primaries. Texas voters have a choice of more competitive races on their general election ballots than at any time since 1994, including contests for congressional house seats, state house seats and, most notably, the first competitive U.S. Senate race this century.
Seventy-two percent of the state’s registered voters say they are either “extremely” or “very” enthusiastic about voting in the 2018 elections, according to the latest University of Texas/Texas Tribune Poll. Seventy-six percent said they were “absolutely certain to vote,” and there’s no obvious enthusiasm gap by party. Will actual turnout approach that enthusiasm level - 76 percent? In a state where midterm elections since the mid-1990’s have attracted no more than 38 percent of the registered voters, a midterm turnout that equals or exceeds the turnout rate of every presidential election this century might seem unrealistic. Nevertheless, only 12 percent of those Texans polled said they were either “not too” or “not at all” enthusiastic about voting this year.
It won’t be clear until the voting is done whether the overall turnout will rival presidential year turnout levels, but it’s clear early voters are showing genuine enthusiasm According to the UT/TT survey, .more than half of poll respondents said they have been contacted by a political campaign during this election season — 36 percent of them by campaigns from both parties, 17 percent by just Republicans and 44 percent by just Democrats.
- Email and text messages were the most common form of contact, followed by phone calls, letters or postcards, in-person visits and social media messages and posts.
While higher turnout has traditionally favored Democrats, the increased competitiveness of many races has also generated enthusiasm among Republican voters. While Texans wait to see whether a much-touted “blue wave” materializes, it looks thus far as if the expected margin of victory in statewide elections is likely to be closer than any midterm this century, no matter who wins.
The University of Texas/Texas Tribune internet survey of 1,200 registered voters was conducted from October 15 to October 21 and has an overall margin of error of +/- 2.83 percentage points. The likely voter sample of 927 voters has a margin of error of +/- 3.22 percentage points. Numbers in charts might not add up to 100 percent because of rounding.Possibly as a result of interest in the U.S. Senate race between incumbent Republican Ted Cruz and his Democratic challenger, Beto O’Rouke, younger voters are voting at higher rates across the state. In Harris County, about 15 percent of all voters were between the age of 18 and 35 — double the percentage of the last midterm election — and their sheer number is four times as large as in 2014. If sustained, this age group’s increased participation could dramatically alter the outcome of many races.
A new Harvard poll conducted in weeks leading up to the start of early voting suggests young Millennial and Generation Z voters may vote in this midterms at levels not seen in at least three decades. The poll may signal that the spike in Millennial political involvement that began after the 2016 election of Donald Trump hasn’t lost steam in the past two years. Other recent data indicate that this engagement transcends typical political activity. “We’re starting to notice that the personal is political,” said Mari Jones, a Harvard student who helped run the poll. “Big events in American politics cause young people to think about politics differently.”
The survey, from the university’s Institute of Politics (IOP), found that 40 percent of young people ages 18 to 29 said they would “definitely vote” in the upcoming midterm elections. Historically, the biannual poll is off by high single digits from actual youth turnout. But if just 22 percent of this group votes, it would be the highest midterm turnout for young voters in at least 32 years. According to IOP’s director of polling, John Della Volpe, in the past three decades youth-voter turnout has only hit 21 percent twice—in 1986 and 1994. To Della Volpe, the potential turnout is starting to look more like it did in the 2016 presidential election than it did during the last midterms, in 2014.Comparing the first eight days of early voting across the top 15 Texas counties for 2018 with 2016 and 2018 turnout numbers, voter turnout is almost at presidential election levels this year by both the percentage of registered voters and raw turnout counts. Keep in mind people have been moving Texas, increasing the state's population and voter registration counts, so raw voter turnout counts are expected to be higher, just from the population increase. Comparing turnout across the years as a percentage of voters registered in each election year yields a better relative turnout comparison across the years than raw numbers.
IOP’s polling suggests that, among young voters, support for the much-hyped blue wave is high. Sixty-six percent of the likely voters surveyed preferred Democrats to win Congress, more than twice the share who preferred that Republicans maintain control (37 percent of those polled live in the South and 21 percent in the Midwest). “If there is a blue wave in America, it will be, I think, started by young people and work all the way up,” said Della Volpe, though he noted that the margin between support for a Democrat-controlled Congress and support for a Republican-controlled Congress has narrowed by seven points among likely voters since IOP’s spring poll. More at The Atlantic...
| 15 Largest Counties | Mail & In Person % Voted 2014 | Mail & In Person % Voted In 2016 | Mail & In Person % Voted In 2018 | Mail & In Person # Voted In 2014 | Mail & In Person # Voted In 2016 | Mail & In Person # Voted In 2018 | |
| Mon | 2.68% | 5.91% | 5.53% | 240,653 | 576,416 | 568,926 | |
| Tue | 4.07% | 10.12% | 9.39% | 365,315 | 987,642 | 965,592 | |
| Wed | 5.41% | 14.31% | 12.73% | 485,754 | 1,396,446 | 1,309,175 | |
| Thu | 6.69% | 18.27% | 16.09% | 600,824 | 1,783,048 | 1,654,950 | |
| Fri | 8.09% | 22.34% | 19.59% | 726,017 | 2,180,292 | 2,015,567 | |
| Sat | 9.32% | 25.73% | 22.84% | 837,149 | 2,511,681 | 2,349,820 | |
| Sun | 9.78% | 27.25% | 24.21% | 878,364 | 2,659,865 | 2,491,109 | |
| Mon | 11.17% | 30.58% | 27.27% | 1,003,027 | 2,985,017 | 2,805,840 | |
| Tue | 12.71% | 33.95% | 0.00% | 1,141,565 | 3,313,842 | 0 | |
| Wed | 14.38% | 37.41% | 0.00% | 1,291,393 | 3,651,023 | 0 | |
| Thu | 16.31% | 41.01% | 0.00% | 1,464,061 | 4,002,626 | 0 | |
| Fri | 19.11% | 46.08% | 0.00% | 1,715,731 | 4,497,431 | 0 | |
| Election Day | 33.56% | 60.87% | 0.00% | 3,013,361 | 5,940,406 | 0 |
The turnout rate in this year’s midterm elections remains unprecedented in Collin County — and all of Texas — going into week two of early voting. Turnout for this midterm election aligns more closely with recent presidential elections than any midterms since the 1990’s.
Through Monday, the eighth day of early voting in Collin County, 209,114 in-person and by-mail ballots have been cast - 74,390 by Republican Party affiliates (median age 59) and 38,969 by Democratic Party affiliates (median age 53) - as determined by party primary voting history. Just over one-third of early voters so far (74,419, with a median age of 47 years) have not voted in either party's primary, and the remainder (13,962) have a history of switching party primaries over the years.
As of the first day of early voting, 14,623 by-mail ballot applications had been received at the election office. More Republicans than Democrats - determined by party primary voting history - requested mail ballots with 6,559 Republicans and 3,672 Democrats (10,231 total) requesting ballots by mail. The other 4,392 people who requested mail ballots have not voted in any party's primary, or they have voted in both party's primaries over the years.
Through day eight of early voting, 12,171 (83%) of the 14,623 by-mail ballots requested for this election had been returned to the election office, largely by senior voters. Few mail ballots sent to voters under age 65 had been returned through day eight. Of the mail ballots returned, 5,337 are from Republican Party affiliates and 3,017 are from Democratic Party affiliates.
The rate of turnout in Collin County has been running ahead of most other Texas counties. Turnout this year started hotter than in the last presidential year, 2016 for the first two days of early voting, but the turnout has cooled slightly over the third through eighth days of early voting.
| Collin County | Mail & In Person % Voted In Collin Co. 2014 | Mail & In Person % Voted In Collin Co. 2016 | Mail & In Person % Voted In Collin Co. 2018 | Mail & In Person # Voted In Collin Co. 2014 | Mail & In Person # Voted In Collin Co. 2016 | Mail & In Person # Voted In Collin Co. 2018 | |
| Mon | 2.1% | 6.8% | 7.3% | 10,312 | 36,719 | 42,511 | |
| Tue | 3.8% | 12.7% | 12.8% | 18,336 | 68,241 | 74,273 | |
| Wed | 5.3% | 18.1% | 16.8% | 25,588 | 96,899 | 97,324 | |
| Thu | 6.6% | 22.8% | 20.6% | 32,076 | 122,582 | 119,338 | |
| Fri | 8.2% | 28.2% | 25.1% | 39,763 | 151,560 | 145,349 | |
| Sat | 9.8% | 33.3% | 29.7% | 47,584 | 178,634 | 172,344 | |
| Sun | 10.3% | 35.2% | 31.4% | 50,040 | 188,861 | 182,125 | |
| Mon | 12.0% | 39.0% | 34.9% | 58,381 | 209,114 | 202,385 | |
| Tue | 13.9% | 42.7% | 0.0% | 67,533 | 229,487 | 0 | |
| Wed | 16.0% | 46.5% | 0.0% | 77,416 | 249,793 | 0 | |
| Thu | 18.2% | 50.5% | 0.0% | 88,495 | 270,853 | 0 | |
| Fri | 21.7% | 56.2% | 0.0% | 105,296 | 301,939 | 0 | |
| Election Day | 36.5% | 68.3% | 0.0% | 177,131 | 366,483 | 0 |

The median age of all voters who have cast their ballot so far is 54 years.
Only 26,624 people (median age 40 years) of the 101,541 voters (median age of 35 years) who registered after the 2016 election have voted through day eight of EV.
Women are turning out at a higher rate than men 52.7 percent to 47.3 percent. (An equal number of men and women are registered.)
Through day eight, 13,251 of the county's 48,788 Latino voters have cast their ballot, and 19,965 of the county's 65,774 Asian and Pacific Islander voters have cast their ballot.
An increasing portion (46% - 92,642) of early voters, with a median age of 46 years, are voting in a midterm election for the first time, with 15.5% (31,327, average age 39) are voting for the first time in a federal election in Collin County. First midterm voter turnout is represented by the green in in the above chart,
Here is a chart of 2018 early turnout by age group as a percentage of the total vote tally through day eight, compared with total turnout for 2014 and 2016.

Remember, relative percentage turnout here is a zero sum game. As one age group increases relative turnout, one or more other groups decrease in proportion. In 2016 younger voter turnout was higher in relationship to older voters. Voters age 18 to 29 are casting ballots at a higher rate than that age group did in 2014, but younger voters are still badly overshadowed by the oldest voter cohorts.
Early voting is very fluid election to election. Each election has its own personality. Sometime the early turnout is front loaded, other years its back loaded, and occasionally turnout is evenly spread across the early period. So comparing same day numbers or percentages election to election does not reveal much. Note: Election percentages for 2014-16 are for the full election and for 2018 the percentage is through day eight.
In Texas, more people vote early than on Election Day. Sometimes, it’s far more people; in 2016, for instance, 73.5 percent of the total votes cast were cast before Election Day. In 2012, the presidential election year before that, 63 percent of the voters cast their ballots before Election Day rolled around.
Midterm voting early is also more popular than Election Day voting, but less so the in presidential election years. In the last midterm election in Texas in 2014, Republican Greg Abbott, then the attorney general, faced Democrat Wendy Davis, then a state senator, in an open race for governor. The early vote tally was 54.1 percent — a smaller portion than in presidential years but still more than half of overall turnout.
The same was true in 2010, when a governor’s race between Republican Gov. Rick Perry and Democrat Bill White, a former Houston mayor, topped the ballot: Early turnout accounted for 53.1 percent of the vote.
However, the turnout split between early voting and Election Day for the 2018 midterm may look more like a presidential year than a typical midterm year.

| Collin County Voting Center | Voter Count |
| Allen ISD Service Center EV026 | 6,360 |
| Allen Municipal Complex EV501 | 13,733 |
| Carpenter Park Recreation Ctr EV601 | 9,628 |
| CC Higher Education EV202 | 3,064 |
| CC McKinney Campus EV043 | 4,998 |
| CC Preston Ridge Campus EV117 | 9,621 |
| CC Spring Creek Campus EV050 | 5,864 |
| Celina ISD Admin Building EV721 | 2,243 |
| Christ UMC EV211 | 7,284 |
| Collin County Elections EV504 | 6,261 |
| Davis Library EV200 | 9,840 |
| Farmersville City Hall EV011 | 1,484 |
| Frisco Fire Station #5 EV219 | 4,899 |
| Frisco Senior Center EV194 | 3,481 |
| Gay Library EV212 | 15,071 |
| Haggard Library EV164 | 6,823 |
| Harrington Library EV602 | 6,335 |
| Lavon City Hall EV213 | 2,286 |
| Lovejoy ISD Admin Bldg. EV174 | 4,041 |
| McKinney Fire Station #7 EV172 | 5,103 |
| Melissa City Hall EV195 | 2,000 |
| Methodist Richardson Med. EV251 | 3,907 |
| Murphy Community Ctr. EV252 | 7,249 |
| Old Settlers Rec. Center EV516 | 1,261 |
| Parker City Hall EV176 | 1,933 |
| Parr Library EV109 | 7,956 |
| Plano ISD Admin Center EV603 | 7,916 |
| Princeton City Hall EV214 | 2,426 |
| Prosper Town Hall EV257 | 4,876 |
| Renner-Frankford Library EV074 | 9,075 |
| Smith Library EV222 | 10,165 |
| Texas Star Bank EV165 | 2,591 |
| Total | 189,774 |
No comments:
Post a Comment